A Special 10-Year Anniversary Edition
It's our 10-year anniversary.
In celebration of our 10 years in the financial research business, this week's Market Edges provides complimentary access to other Hedgeye products to which you might not have access.
Enjoy!
Also, here's a special thank you for subscribing from CEO Keith McCullough.
|
Dear Hedgeye subscriber, I want to take a minute to welcome you to our growing community of investors searching for a better way. Thank you for placing your trust in us. Together, my team of 40+ analysts and I are hard at work tearing down the edifice of Old Wall Street, brick-by-brick. There's much more work to be done. Our story starts with my mother. It was November 2007. I had just been fired from the hedge fund I was working at (for being too bearish). Back then my father was a firefighter and my mother was a teacher, so it was an extremely humbling moment when my mom asked me, "How do you change the world with your job?" Remember, this was around the time the U.S. economy tipped into its greatest downturn since the Great Depression. Making matters worse, the Financial Crisis exposed the worst in Wall Street: Its conflicts of interest, unaccountability and opaqueness. There had to be a better way. So we got to work. In 2008, Hedgeye was born. From the beginning, we envisioned a level playing field between Wall Street and everyday investors. Our founding principles remain transparency, accountability and trust. We don't have an investment banking arm. We don't have a proprietary trading desk. We only prosper by delivering to subscribers the sharpest research around. Period. In other words, my co-founders and I created something that didn't exist: Hedge fund-quality research for every day investors. On a closing note, you're in good company with your subscription. Many of the world's smartest, most successful investors rely on our investment research. Our goal since Day One has been to create the most thoughtful research to help investors like you protect your portfolio and profit from the opportunities Mr. Market provides. As always, thank you for subscribing to Hedgeye, Keith R. McCullough
Chief Executive Officer
|
WEEKLY ASSET ALLOCATION
CLICK HERE to read this week's full asset allocation update. CLICK HERE to watch a brief video, “Understanding How We Think About Asset Allocation."

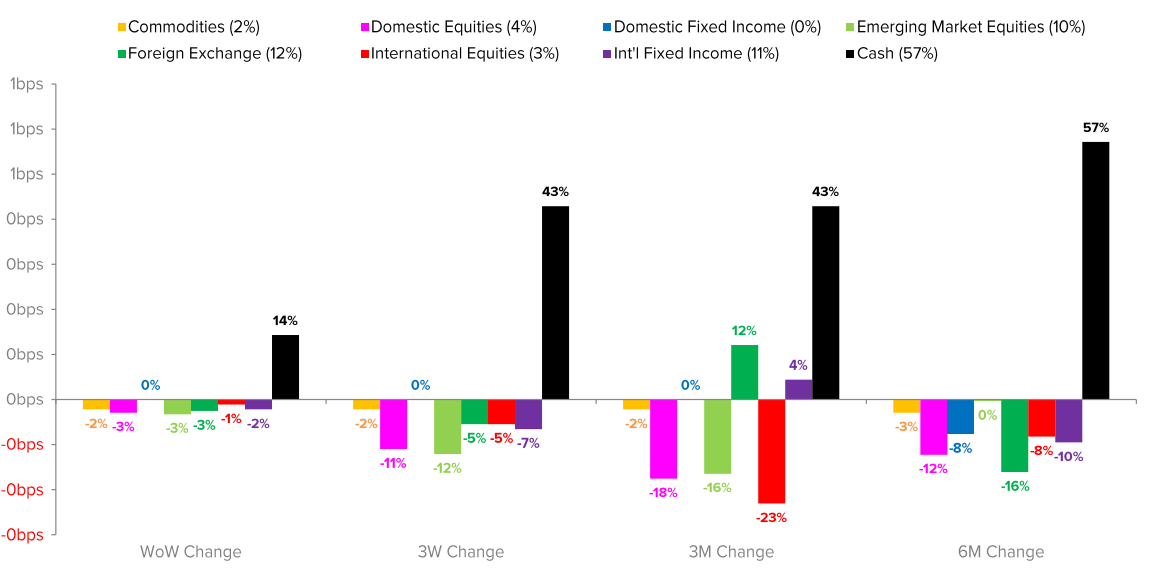
EDITOR'S NOTE: TACRM (Tactical Asset Class Rotation Model) asset allocation signals are generated using our highly quantitative risk management system that relies on mean variance optimization techniques to attempt to produce superior risk-adjusted returns in a diversified global portfolio on an ex-ante basis. CLICK HERE to read this week's full TACRM asset allocation update along with the accompanying bullish and bearish exposure signals.
CLIENT TALKING POINTS
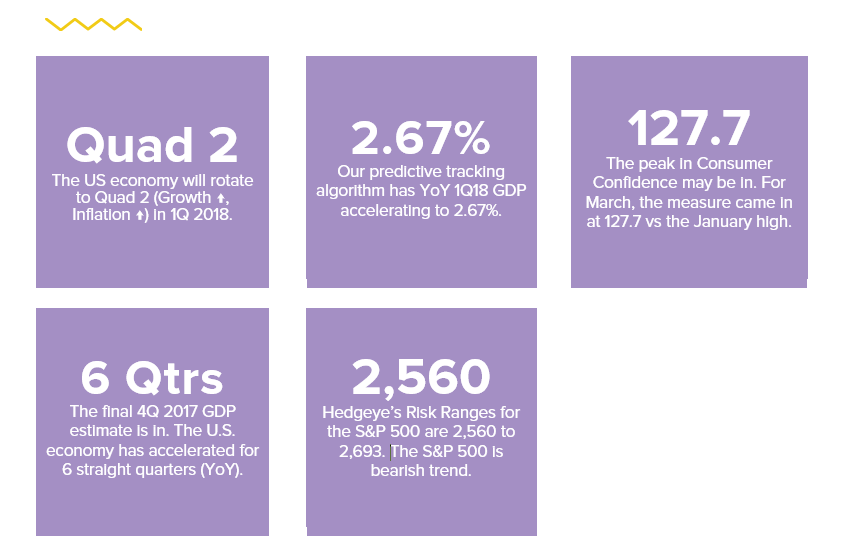
4Q 2017 GDP, Consumer Confidence, Style Factors
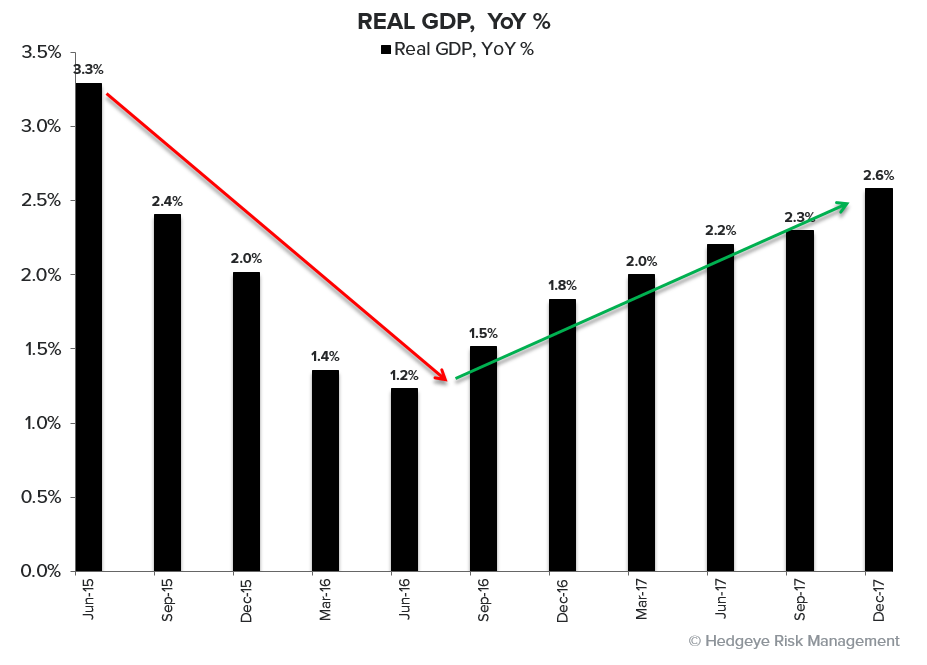
1. Final Update on 4Q 2017 GDP
The 4Q 2017 final U.S. GDP estimate got a sizeable positive +40bps revision to the headline with consumption and investment providing the upside:
- Headline GDP was revised +40bps to +2.9% Q/Q SAAR (the third consecutive quarter of GDP near 3%)
- Year-over-year GDP was revised +10bps to +2.6%
- Personal Consumption growth was revised higher by 20bps to 4.0% QoQ SAAR, with a +17 basis point increase (from a contribution perspective) from Services & Non-Durables
- Most of the positive Investment juice came from the inventory side (contribution revised +17bps) while Resi investment was revised marginally lower and NonResi marginally higher
- GDP Deflator and Core PCE Deflator were unchanged at 2.3% and 1.9%, respectfully
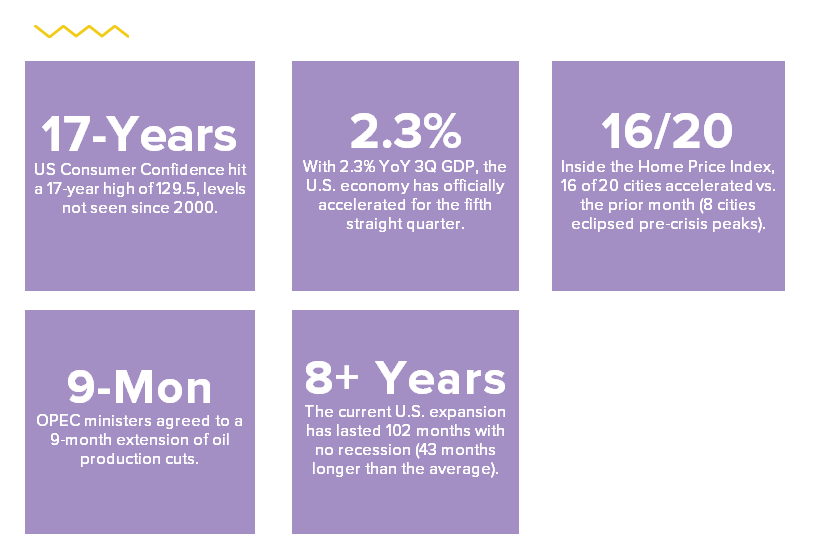
So, the 6 straight quarters of conspicuous acceleration in growth gets its final confirmation. The positive revision, of course, now become the (harder) comp.
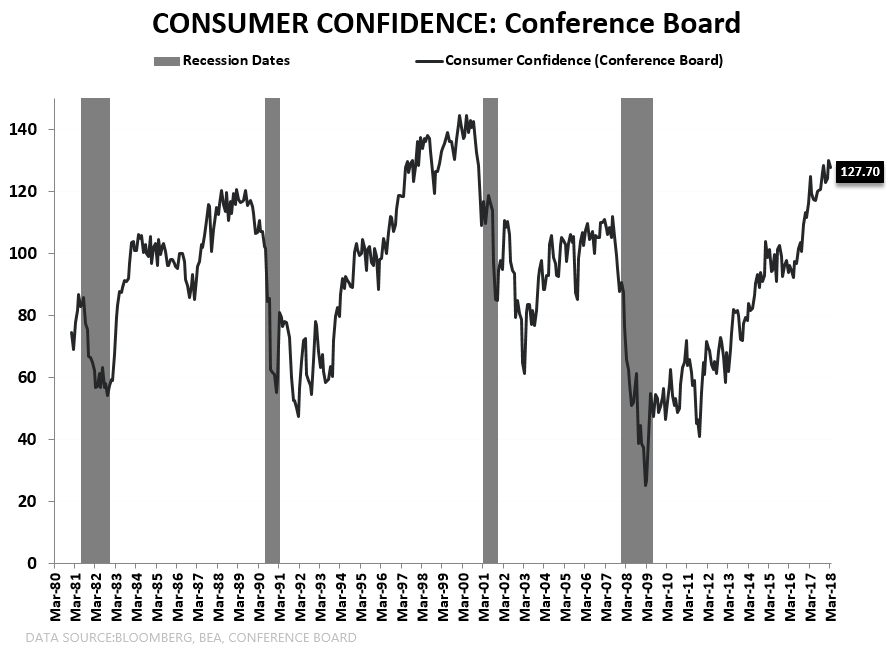
2. Consumer Confidence: Was This the Peak
US Consumer Confidence is down -3.1 points from the cycle high of 130.8 in February (which came on the heels of the stock market’s epic all-time highs in January) to 127.7 in March.
Was February the peak? We think that was the peak for both Global Growth & Inflation Expectations (positioning). We’re data dependent on calling the US cycle, so this is more of a question than an answer.
Most charts like this were big time tailwinds to our bullish view on both the US economy and its stock market through January 2018.
3. Style Factor Performance = Reflation's Rollover
This is interesting. The top performing "style factors" over the past 3 months, 6 months and year-to-date are precisely the opposite of what's been outperforming over the past week and month. Let's just take one example. As you can see in the chart below, "Low Beta" stocks are starting to outperform "High Beta" stocks.
That has a lot to do with our call on Reflation's Rollover. Low Beta stocks like Utilities perform well in a falling interest rate environment. Utilities stocks are up 3% over the past month versus -2.7% for the S&P 500. All other sectors but, no surprise here either, Energy (XLE) are negative in the past month.

CHART OF THE WEEK
Early Look: Tremendous Impact
Below is an excerpt and chart from a recent Early Look written by Hedgeye CEO Keith McCullough. Click here to read this Early Look in its entirety:
|
With the end of March comes the end of the 1st quarter of 2018. It was a quarter marked by massive reversals in the aforementioned two things in particular. Facebook (FB) and the UST 10yr Yield peaked in FEB and got smoked in March. Smoked? Really? Is the 10yr Yield dropping -20 basis points a good ole fashioned smoking? On an absolute basis, obviously not. But think about what that move in bond yields did to US Equity Sector Styles that were getting smoked in JAN-FEB like Utilities: A) For the month of March Utilities (XLU) are up +2.5% absolute and +6.5% relative to the SP500 While Reflation’s Rollover wasn’t much in basis points of headline “inflation” either, being long of “reflation” from the peak of inflation expectations with the UST 10yr yield at 2.96% in FEB was a terrible portfolio position to take. Our job as your Global Macro Risk Manager is to try to help you avoid getting smoked. That’s the whole point about our Quarterly Macro Themes product. It’s to proactively prepare you for market risks that are becoming A) increasingly probable in our data driven model, but are priced as B) improbable by consensus. To review, our Q1 Macro Themes were:
“So”… I think we did our job, especially with Themes 1 and 2. Theme 3 is starting to get more interesting by the day as the US Dollar continues to make a series of higher-lows. Long EM (Emerging Markets) wouldn’t like a breakout in the US Dollar. In fact, if inverse correlations and carry trades are still trending, there aren’t many things in Global Macro that would enjoy a breakout in USD. That said, before it breaks out, it needs to bottom. Is The US Dollar Bottoming? That question will be one of our Q2 Macro Themes that we’ll introduce next Tuesday. Per Hedgeye Research Jedi, Ben Ryan: “Peak Dollar bearishness came midway through Q1 which was driven by carry trades and fund flows associated with the low-volatility, global growth accelerating backdrop of 2017. We’ll outline reasons and provide specific set-ups to exemplify why a reversal in the US Dollar continues to be a major risk to aging consensus fund flow narratives.” That’s right. Our #GlobalDivergences call (which we’ll reiterate as a Macro Theme again in Q2) feeds the beast of a potential USD bottoming call. We’re quite happy that the “Globally Synchronized Recovery” crowd disagrees with that. What are a few other big macro things that consensus doesn’t agree with us (yet) on? A) That both Global Growth & Inflation expectations have put in a cycle peak Yep. After being higher than consensus on US GDP growth for 5 quarters in a row, now we’re the lowest on Wall Street from a headline nowcasting perspective. |

TOP 5 STATS
SECTOR SPOTLIGHT
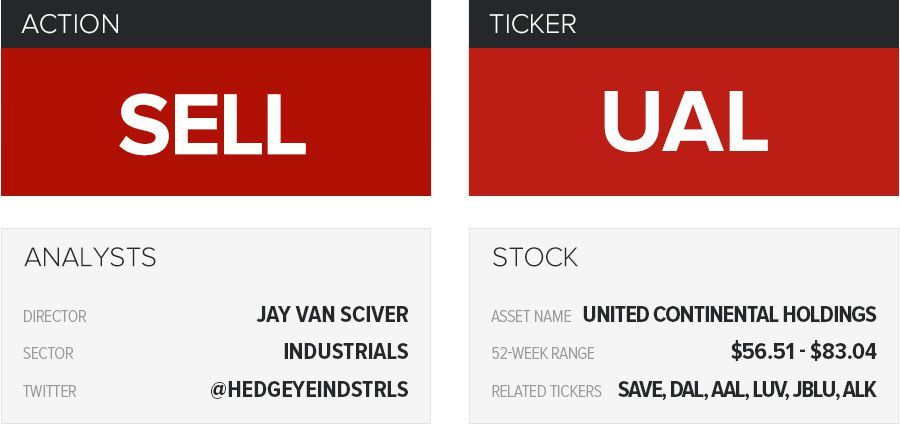
Investing Ideas Stock Report: United Continental (UAL)
Below is a complimentary Investing Ideas "stock report," outlining Industrials analyst Jay Van Sciver's short thesis on United Continental (UAL). Investing Ideas is our weekly newsletter of our 40+ research analysts' favorite stock ideas.
|
Takeaway: We added UAL to Investing Ideas on the short side on 2/14. |
THE HEDGEYE EDGE
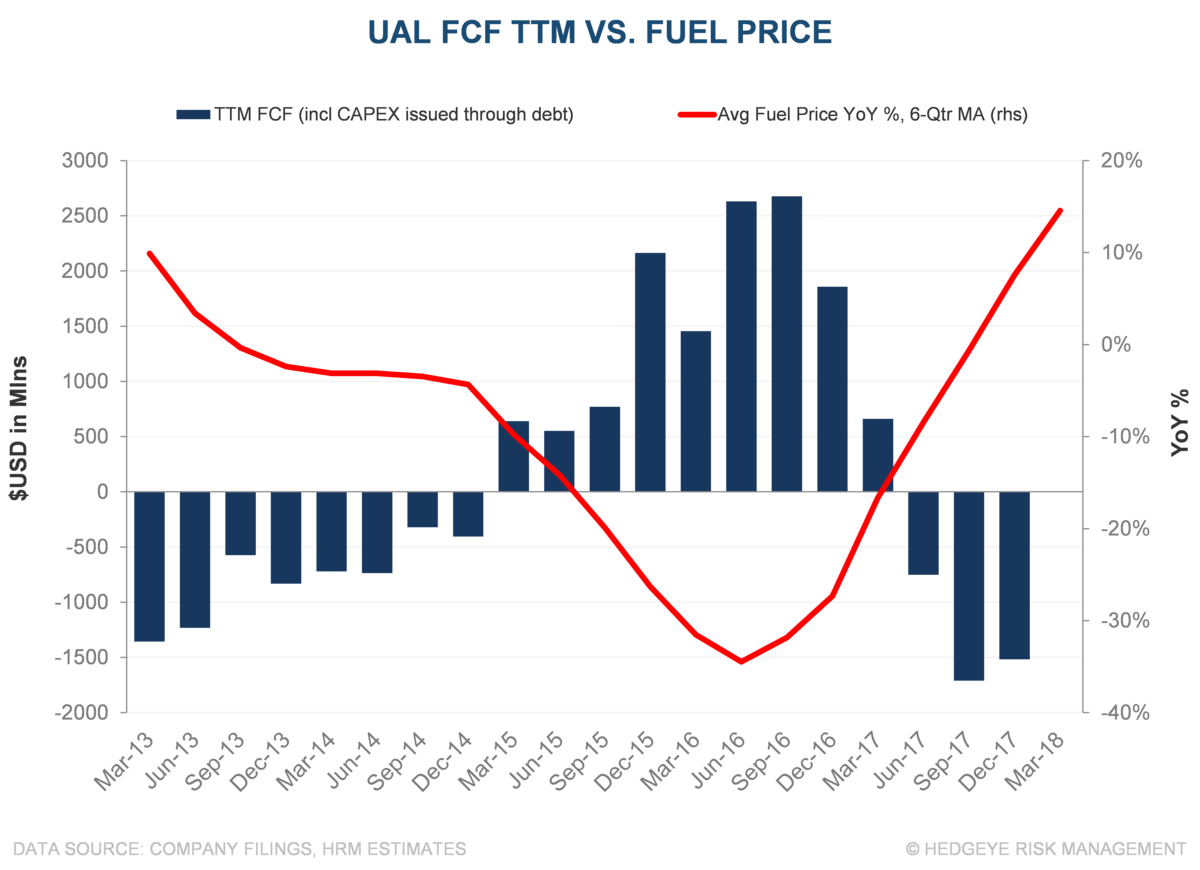
United Continental (UAL) is a high cost airline that has struggled to generate positive free cash flow in a favorable economic environment.
The road ahead looks increasingly rough for UAL. Our pricing data suggests they have exited a price war with a lower cost airline. What did UAL gain? Flat market share growth and lots of shareholder pain.
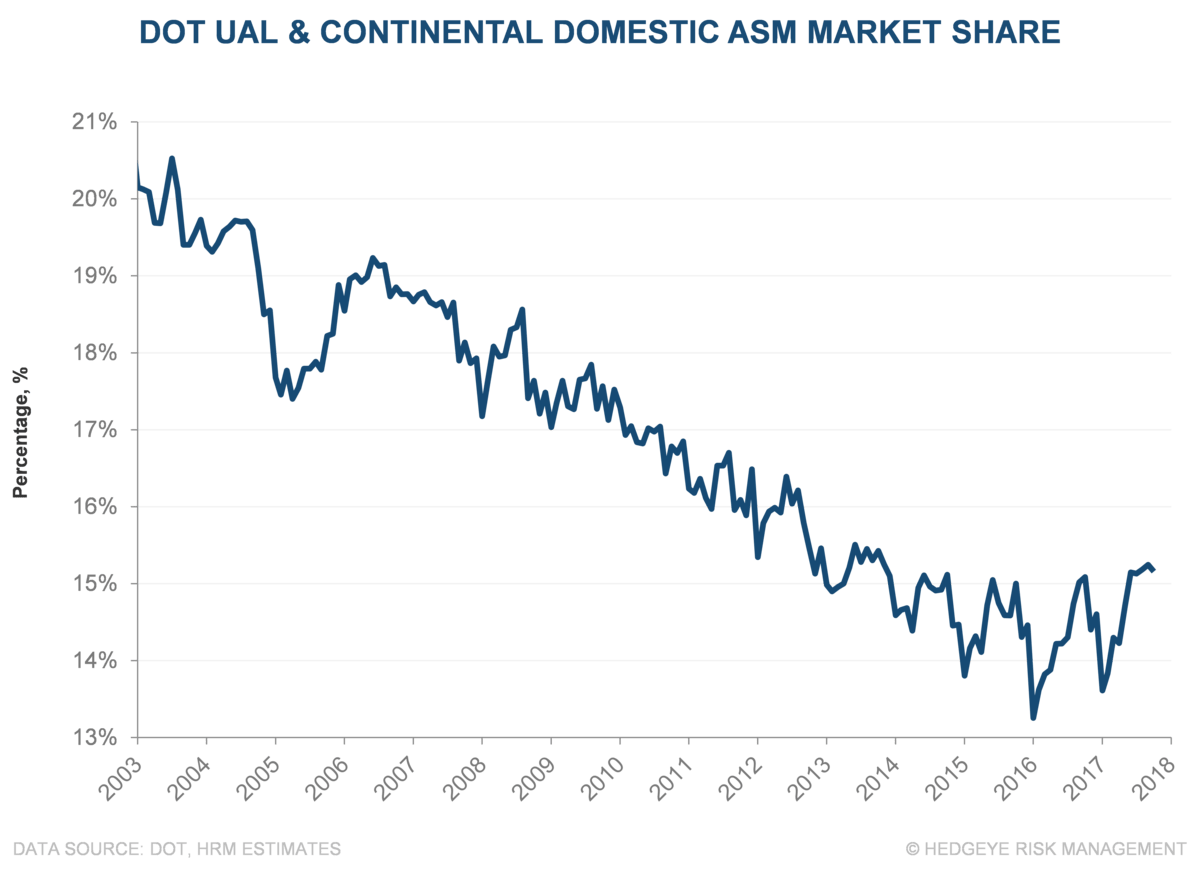
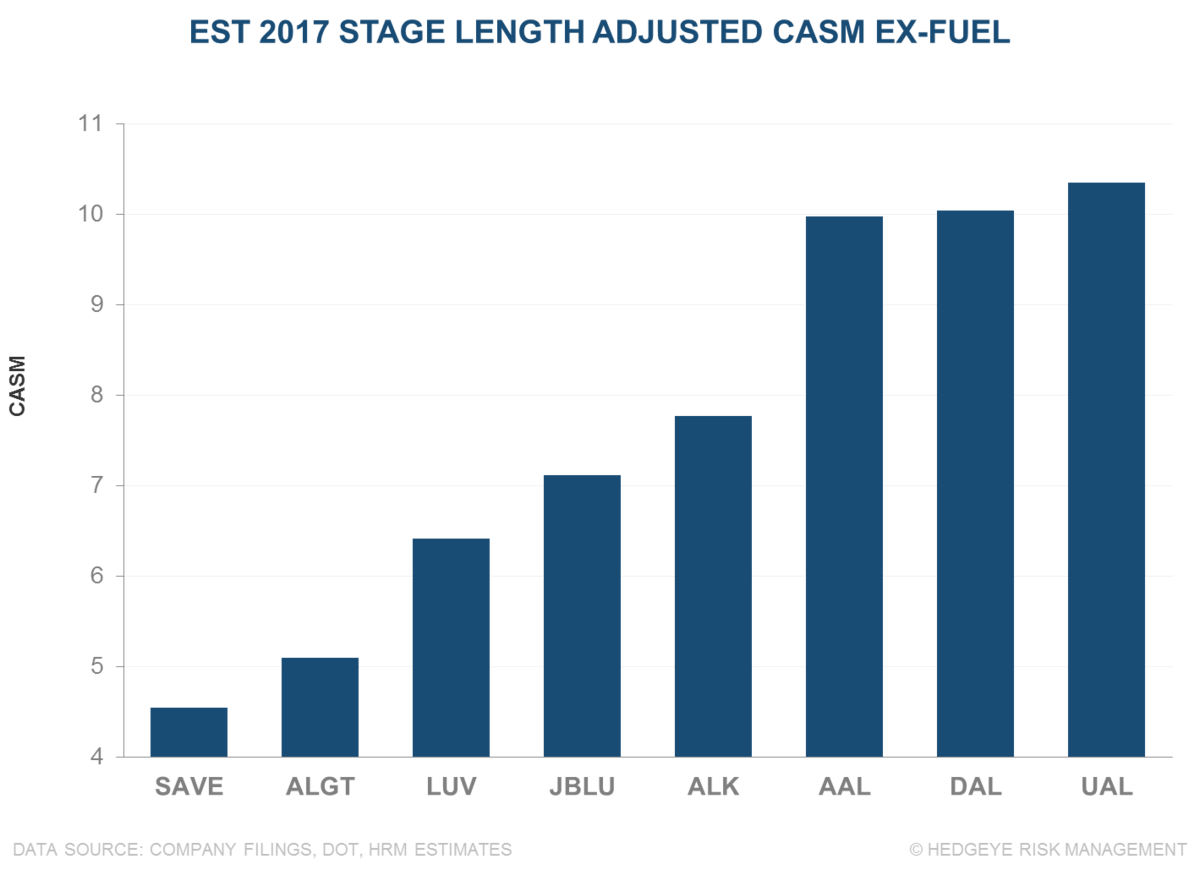
It is typically easier to take fares down than back up, particularly if the goal is to drive higher utilization and ASM growth in a higher fuel price environment. The highest cost, legacy operators, like United Continental (UAL), who have basically ceded share to keep pricing high, are losing share to nimble, low-cost providers. We continue to think that UAL will be trapped by an unpossible dilemma, choosing between lower fares, higher share, and more rapid cash burn versus higher fares, more rapid share loss, and slower cash burn.
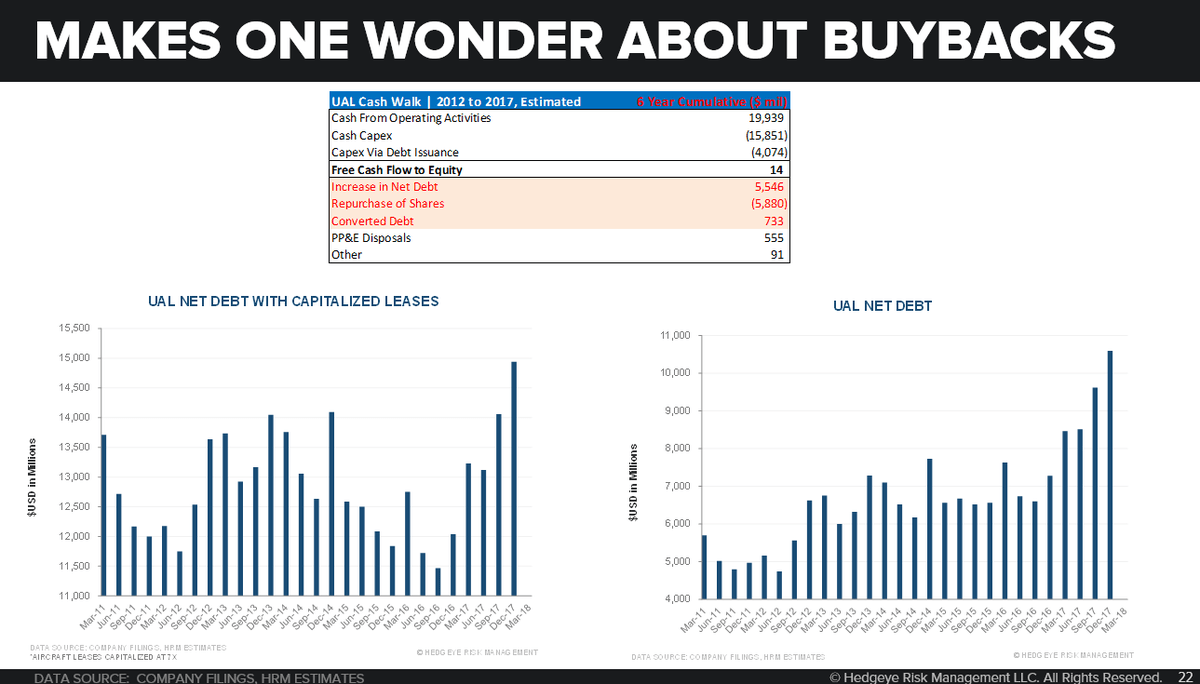
UAL burns cash – Free Cash Flow is negative. If one values UAL as an operating company, it should be worth the present value of future free cash flows to equity. If an airline burned cash over a 6 year period during decent economic activity, and burned cash in 2017, which was a very robust macro economy, a period over which its fleet aged and it “was shrinking”, what would that equity be worth?
BOTTOM LINE
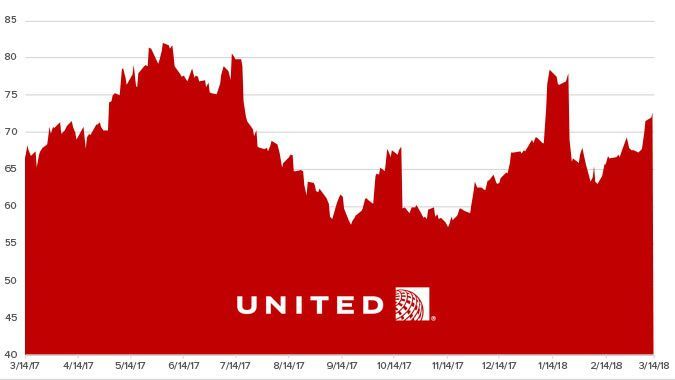
We continue to see UAL struggling to generate cash in 2018. The company is flailing as it copes with an inferior cost and hub structure in addition to a deteriorating balance sheet. With fuel prices and competitive intensity both looking like headwinds in 2018, we expect shares of UAL to trend lower.
ONE-YEAR TRAILING CHART
WHAT THE MEDIA MISSED
The Macro Show (Complimentary): A Playbook for the Next Bear Market

Financial markets are getting wild.
Investors are getting whipped around.
The mainstream media is no help.
What if some savvy hedge fund manager gave you their “Investing Playbook” to help you navigate the next bear market? That clear-headed investing framework would definitely help, right?
You’re in luck.
It’s our 10-year Anniversary.
Come celebrate with us.
Get access to (former hedge fund manager and Hedgeye CEO) Keith McCullough’s “Investing Playbook for the Next Bear Market” …
Join us LIVE Monday April 2 at 9:00am ET for a special, complimentary edition of The Macro Show. (CLICK HERE for access to The Macro Show.)
“When Hedgeye was founded in 2008, our goal was to create something that didn’t exist: Hedge fund-quality research for everyday investors,” McCullough says.
In this special 10-year Anniversary edition of The Macro Show, Hedgeye CEO Keith McCullough will discuss his strategy to help you navigate increasingly volatile financial markets.
AROUND THE WORLD
RISK RANGES: COMPLIMENTARY ACCESS
“If I could only use one tool of the many investing tools we have, it would be my daily ranges. What else would I use? You could be as blind as a bat and sell at the top of the range, and buy or cover at the low end of the range.” – Hedgeye Founder & CEO Keith McCullough
An important question for you.
Are you using a reliable quantitative risk management process which helps you stick to the most basic investing maxim around?
Buy low, sell high.
That’s precisely what our Risk Ranges are designed to help you do. (CLICK HERE for complimentary access to our Risk Ranges.)
Risk Ranges were originally developed by Hedgeye CEO Keith McCullough during his years as a hedge fund manager to augment his analyst team’s qualitative research views. (Click here to read our Risk Ranges user guide.)
Good news.
We’re offering complimentary access to our Risk Ranges today – 25 critical trading ranges for major indices (like the S&P 500), large cap stocks (like Apple and Amazon) and ETFs (like Energy (XLE) and (Biotech (IBB))
Take a look. You won’t regret it.

THE WEEK AHEAD

