Are You Bullish Enough? Wall Street Isn't.
Despite all of the bullish data points piling up out there, Wall Street's reaction to U.S. #GrowthAccelerating remains somewhere between ho-hum and disbelief. Our analysis of CFTC futures and options data reveals that big banks and hedge funds didn't buy the recent dip in the Nasdaq and S&P 500. Rather, Wall Street consensus sold the December lows. And what happened? The stock market ripped right back to all-time highs.

While Wall Street hasn't been bullish enough, we've been reminding Market Edges subscribers that the U.S. economy is still accelerating. US Retail Sales came in red hot last week, marking the fastest pace of year-over-year growth in over 5 years. Meanwhile, Industrial Production hit a 36-month high. We tackle both economic indicators in Client Talking Points this week while providing an update on what it means for our U.S. economic forecast in Chart of the Week.
In other feature sections this week, we detail how investors need to be positioned ahead of Reflation's Rollover (see What the Media Missed). The short answer is sell commodities exposure. In Sector Spotlight Housing analyst Christian Drake explains why the proposed Republican tax reform bill is bearish for high-end U.S. housing. And finally, Senior Macro analyst Darius Dale provides a critical update on our outlook for Japan in Around the World.
WEEKLY ASSET ALLOCATION
CLICK HERE to read this week's full asset allocation update. CLICK HERE to watch a brief video, “Understanding How We Think About Asset Allocation."


EDITOR'S NOTE: TACRM (Tactical Asset Class Rotation Model) asset allocation signals are generated using our highly quantitative risk management system that relies on mean variance optimization techniques to attempt to produce superior risk-adjusted returns in a diversified global portfolio on an ex-ante basis. CLICK HERE to read this week's full TACRM asset allocation update along with the accompanying bullish and bearish exposure signals.
CLIENT TALKING POINTS
Holy Cow! U.S. Economic Indicators ... RiPping
1. Small Business Optimism Hits All-Time Highs
In other unemotional, apolitical, and non-fake-news, US Small Business Optimism (NFIB reading) ripped to an all-time high last week of 107.5. The November reading was led by sub-index gains in "forward expectations" and “hiring plans” which was also at an all-time high. The small business index mirrored the recent 204-month highs in Consumer Confidence.
2. Industrial Production Growth Hits 36-Month Highs
Industrial Production rose +0.2% sequentially, accelerating to a new 36-month high at +3.35% year-over-year. Comps across a swath of macro metrics (IP, Durable Goods, Income/Consumption) get moderately tougher beginning in December but the 2nd derivative mojo remains firmly in place.
3. Retail Sales Growth Hits 68-Month Highs
"Holy cow are you kidding me with this Retail Sales print," wrote Senior Macro analyst Darius Dale last week. Headline Retail Sales rose +0.8% month-over-month (on back of positive revision to Oct) and accelerated to +5.8% year-over-year. That marks the fastest pace of growth since March 2012.
Incidentally, the Retail Sales Control Group (a proxy for the retail sales input to GDP) was also up +0.8% sequentially and accelerated to +4.8% year-over-year. That was the fastest pace of growth since November 2014. Fourth quarter retail sales is currently tracking at 5.4% quarter-over-quarter annualized. That would be the best reading since 2Q16.

CHART OF THE WEEK
BOOM! An Update to Our U.S. Growth Forecast
Below is a brief note written by Senior Macro analyst Darius Dale updating our Growth, Inflation, Policy model (GIP):
|
"I don’t know how much more can be said about the strength of this recovery and how much Macro Tourist whining about how soft data was allegedly diverging from hard data failed to get U.S. Growth Bears paid in 2017. The muted response across Macro markets to this gangbusters Retail Sales print probably speaks more to our call to “sell the [rate hike] news” at the top-end of the @Hedgeye Risk Ranges than anything else. With the advent of this data, our predictive tracking algorithm is now up at +2.65% YoY/+2.99% QoQ for 4Q 2017 GDP. More follow-through will likely push the U.S. economy over +3% on a headline basis for the third consecutive quarter. This is getting downright silly relative to the trend level of real GDP growth we’ve gotten used to throughout the post-crisis era. The only thing sillier than that is completely missing this awesome recovery in U.S. growth and profits we’ve been forecasting for over a year now!" |
Looking to this week, Existing Home Sales for November should continue to underwhelm (hugging the 0% growth line) as supply remains an acute volume constraint, Housing Starts will remain rate-of-change solid against an easy comp and continued improvement in new single-family construction, Household Income Growth will be solid, the rich will still be rich (i.e. asset price inflation will continue to show up in high ticket discretionary consumption) and core Durable/Capital Goods may backslide modestly off of multi-year highs.
Queue the positive GDP revisions...

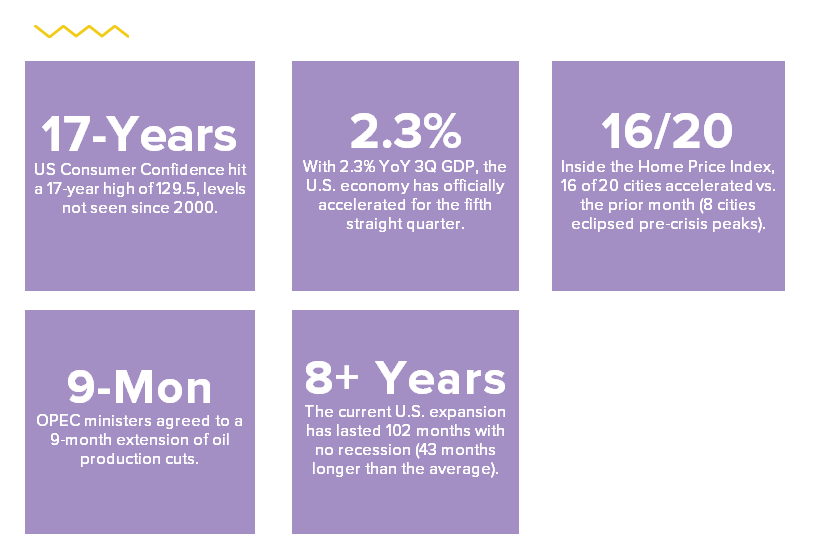
TOP 5 STATS

SECTOR SPOTLIGHT
TAX REFORM = Bad News For High-End Housing
The Republicans' proposed tax reform bill is expected any day now. The bad news? It would have a “decidedly negative” impact on high-end real estate. Below is analysis from a recent Early Look written by Housing analyst Christian Drake:
|
"In presentations over the last month we’ve highlighted the elevated risk to (already tight) supply conditions in the housing market stemming from provisions in the tax reform legislation. One of the lesser talked about proposals is the “exclusion of sale” provision which mandates a seller, in order to qualify for exclusion of capital gains on sale of a home, to live in the property as a primary residence for 5 of the last 8 years (currently 2 of the last 5 years) and could only take that exemption every 5 years (currently every 2 years). The National Association of Realtors provided some confirmatory research this week stating that roughly 22% of recent owner-occupied home sellers owned their residence between 2 to 5 years. Legislation that further disincentivizes (a potentially large) supply will negatively impact volume and housing turnover." |
There's more.
The bill would also greatly affect the state and local tax (SALT) deduction for high-end homeowners in places like New York City, Westchester County and Connecticut. If you distill this whole thing down from a legislative perspective it boils down to: How can we pay for this and who can we take money from? It turns out it’s high-income earners in high SALT states where they have high property values.
So what does this mean for these areas – like Boston, San Francisco and others? Longer-term, it could mean relocation of businesses and residents. It definitely has the capacity to be a self-reinforcing negative. If the SALT reduction is eliminated and those states have out-migration, which would result in a lower tax base just as benefit, retirement, and pension obligations are ramping, that puts a state in an even more precarious position by forcing them to raise taxes.

WHAT THE MEDIA MISSED
PPI Growth Hits 5-Year High... NEXT UP? Reflation's Rollover
The Fed just raised interest rates for the fourth time since December 2015. But one thing continues to puzzle media outlets and outgoing Fed chair Janet Yellen: Inflation. "We have a 2 percent symmetric inflation objective," Yellen said at last week's post-FOMC meeting press conference. "For a number of years now, inflation has been running under 2 percent, and I consider it an important priority to make sure that inflation doesn't chronically undershoot our 2 percent objective."
We have some bad news for Yellen. After a ramp in inflation these past three months, the Fed should expect inflation to fall in the coming months. Here's insight from CEO Keith McCullough:
|
"The recent Producer Price Index reading was probably the capstone for the recent Reflation Trade (3 month macro move off the August lows). The headline PPI accelerated for a 5th consecutive month, breaching the 3-handle to the upside and marking the fastest pace of wholesale price growth since Jan 2012.
Don’t forget that this was A) NOV data and B) DEC has seen a meaningful correction in commodity prices." |

The Fed bit on inflation and GDP accelerating hook, line, and sinker. In Q1 of 2018, they’ll have to tone back to on-the-margin-dovish on Reflation’s Rollover against very difficult Q1 2017 inflation compares.
Other confirmatory inflation evidence this week: Headline CPI accelerated +20bps sequentially or +2.2% year-over-year rising +15bps. Our Inflation Tracker is calling for a deceleration in December to +1.9%. Obviously to the extent commodity deflation persists (CRB Index now bearish TREND), the risk of a deceleration to the mid-to-low ~1.8% range would solidify our #Quad1 (U.S. Growth accelerating, Inflation decelerating) forecast.
From a positioning perspective this means staying away from the the commodity complex since its subcomponents have largely flipped back to bearish trend via our quantitative Daily Trading Ranges model. Below is a breakdown of various commodities-related assets, performance data and their trend signals:
- Energy Stocks (XLE) were down -0.8% last week to -8.8% YTD = Neutral TREND @Hedgeye
- CRB Commodities Index down -0.3% on the week to -4.1% YTD = Bearish TREND @Hedgeye
- Natural Gas was down another -5.8% last week taking its 2017 crash to -30.9% YTD = Bearish TREND @Hedgeye
- Copper reflated +5.2% last week to +24.1% YTD = Bearish TREND @Hedgeye
- Corn deflated another -1.5% last week to -10.7% YTD = Bearish TREND @Hedgeye
- Coffee deflated another -1.5% last week to -19.3% YTD = Bearish TREND @Hedgeye
- Sugar deflated another -2.8% last week taking its 2017 crash to -26.5% YTD = Bearish TREND @Hedgeye
- Orange juice deflated another -5.7% last week taking it back into crash mode at -22.4% YTD = Bearish TREND @Hedgeye
The bearish set-up in our Daily Trading Ranges for Commodities matches our other quantitative asset allocation tool TACRM (Tactical Asset Class Rotation Model). In TACRM, Commodities exposure has been cut to 1% (down 4 percentage points in the past three weeks). Click here to review this week's TACRM factor exposure signals for Commodities (on page 16) which are largely bearish.

AROUND THE WORLD
Bullish on Japanese Growth & Stocks
Below is a note from Senior Macro analyst Darius Dale:
In light of the latest economic and financial market signals, we are keen to reiterate our positive bias on Japanese equities – particularly in the context of the increasing scarcity of [accelerating] growth as identified in our thematic research.
The key takeaway from our Q4 Macro Theme titled, “Synchronized Global #Divergences” was that global growth momentum had peaked in Q3 and was set to broadly trend lower over the next twelve months – with a few noteworthy exceptions of course. Japan, much like the USA, was one of the positive exceptions.
Specifically, the Japanese economy has been in #Quad1 (Growth Accelerating, Inflation decelerating) or #Quad2 (Growth and Inflation Accelerating) every quarter since 2Q16 and our GIP Model projects that trend to continue through 1Q18E. While the topping process is in for leading soft data like confidence indicators and PMIs, the hard data continues to hold up well and easing base effects support upside over the next few months.
We wouldn’t, however, confuse what’s happening cyclically in the Japanese economy with Japan’s demographically-challenged potential growth. That’s not to say Japan can’t continue its solid run for a little while longer. Indeed, the Japanese economy is on solid ground with respect to how we quantify the risk of impending recession through the dual lens of adverse selection and tightening financial conditions.
Japan is in the “sweet spot” in investing terms – accelerating growth, but with no threat of tightening out of the BoJ, per the muted trend in core inflation and Governor Kuroda’s repeated reassurance that the central bank will continue to wholeheartedly support Abenomics via ongoing LSAP. His term ends in April so expect him to “campaign” for reappointment in the coming months.
Taken together, all of this explains why we added long Japanese equities (DXJ) to ETF Pro on 11/16/2017. The recent pullback in the Japanese yen from its 9/8 YTD high is highly supportive of an EPS windfall for Japan’s large-cap exporters. Indeed, growth in Japanese exports continues to accelerate on a trending basis and the recent yen weakness might perpetuate an upside surprise in the coming months. Most recently, the value of Japanese exports rose 16.2% year-over-year, the biggest gain since August.
For more, click here and flip to page 32 to review the International Equities factor exposures in our TACRM asset allocation model. TACRM shows bullish trend for Japanese equities and exposure to International equities more broadly sits at 19% currently (up 13 percentage points in the past 3 months).

THE WEEK AHEAD

