
Image by rawpixel from Pixabay
There’s an ongoing debate about whether or not the U.S. is approaching a recession. As an investor, this question is of utmost importance. It is precisely at these times when fortunes can be made and lost. There’s no shortage of pundits with strong opinions in both the affirmative and negative camps armed with plausible narratives and supporting data sets. How to decide which side to take? Applying some proven forecasting methods to historical data can help bring clarity to this question.
Forecasting is tricky business. It’s really hard to do well consistently, especially in investing. Fortunately for us, Philip Tetlock has made a study of forecasting. In the book Superforecasting: The Art and Science of Prediction (aka Superforecasting) he and coauthor Dan Gardner share their findings of a multi-year study aimed to discover the best forecasters, uncover their methods, and to determine if forecasting skills could improve. There are many great lessons conveyed in the book. We can thus apply them to our problem at hand: the question of whether or not the U.S. will enter a recession.
The Lessons
By running a series of geopolitical forecasting tournaments, Tetlock and Gardner discovered a group of elite forecasters and uncovered their best practices. Ironically, specialized knowledge played little role in their success. Rather, it was their approach.
Superforecasting had a profound impact on me. I took away a more concretized framework for dealing with predictions. Rather than feeling my way through a situation, Superforecasting gave me a method I could apply. Well-devised forecasts share four characteristics:
- They’re probabilistic
- They start with a base rate formed by an “outside view”
- They’re adjusted using the specifics of the “inside view”
- They’re updated as frequently as required by incoming facts, no matter how small the increments
Think Probabilistically
The best forecasters (aka Superforecasters) made predictions in a probabilistic manner. In other words, outcomes weren’t binary—i.e. something would or would not occur. Rather, the Superforecasters ascribed a probability to a forecast. For example, they would assign a 30% chance to the U.S. entering a recession rather than saying it was unlikely. This precision is important.
Establish a Base Rate Formed by an “Outside View”
Before making a prediction, the Superforecasters first established a base rate informed by an “outside view.” A base rate is merely a starting probability. It will later be adjusted. An outside view, as introduced in his book Thinking, Fast and Slow by Daniel Kahneman, is a perspective that looks for historically analogous situations for guidance.
To establish a base rate using an outside view, we should first look at previous recessions and periods where economic conditions were similar. How often did conditions deteriorate into recessions? What events tended to precede them? This should give us starting point.
Adjust Using the “Inside View”
After establishing a base rate using an outside view, the Superforecasters adjusted it by taking an inside view—another Kahneman concept. An inside view is a perspective that only considers the situation at hand. It ignores historical precedents and seeks to induce an outcome using only the current facts. In a sense, every situation is treated as unique.
Thus, the Superforecasters considered both the historical context and idiosyncratic characteristics to inform their predictions. In a lot of ways this resembles using deductive and inductive reasoning in concert with each other; a practice I condone. To follow with our example, a Superforecaster would adjust their 30% recession base rate up or down based on current economic and market conditions. It might be increased due to the prospect of a trade war; it might be reduced based on strong jobs data.
Frequently Updated
Lastly, the Superforecasters frequently adjusted their forecasts. They constantly updated their probabilities, even in increments that seemed insignificant if warranted by new information. While this might sound trite, Tetlock and Gardner found it to be a key component of accuracy. Thus, forecasts might be changed with each presidential tweet in our ongoing example.
Establishing a Recession Base Case
Armed with an improved forecasting method, I applied it to the recession question. I ditched my bullish or bearish perspective and established an outside view base rate. Here, I illustrate my process using two of the most hotly debated metrics: the Institute for Supply Management’s Purchasing Manager’s Index (PMI) and the U.S. Treasury yield curve (YC), defined by the 10 year U.S. Treasury bond minus the Federal Funds Rate.
I compiled monthly data through July 2019. I then looked at the frequency of negative monthly returns for the S&P 500 index (SPX) after a specific threshold was breached. For the PMI I used its latest reading of 51.2. For the YC I looked at periods of inversion (i.e. when the spread was zero and below). Once these months were identified, I calculated the SPX’s return over the following 1 month, 3 months, 6 months, 12 months, and 24 months.
Note that I analyzed SPX returns and not whether or not a recession occurred. As an investor, my only concern is if asset prices will rise or fall, not recessions as such. It just so happens that recessions and falling stock prices coincide; but it’s the values that we ultimately care about, not recessions.
Findings From PMI Data
Below is my analysis of SPX returns for when the PMI historically reached these levels (51.2). Note that my data covered 858 months for my 1 month sample period and 835 months when looking at 24 month returns (i.e. 23 less data points). The PMI was 51.2 or below in 322 of those months, or ~38% of the time across sample periods. During these instances, successive SPX returns were negative for 14% of the months using a 24-month time horizon and 35% of the months using a 1-month one. Thus, 29% is a reasonable base rate for taking a bearish stance on the SPX over a 6 month time horizon using an outside view of PMI data.
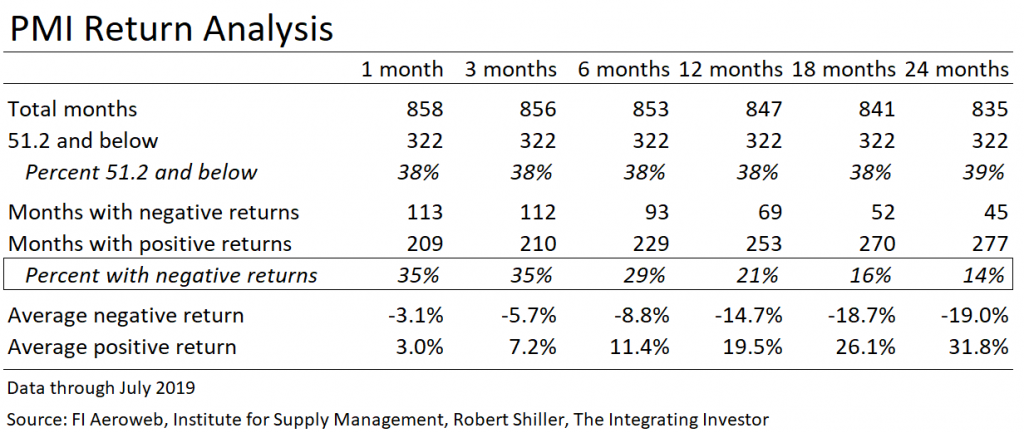
Also, note that the longer the negative return environment persisted the larger the average losses.
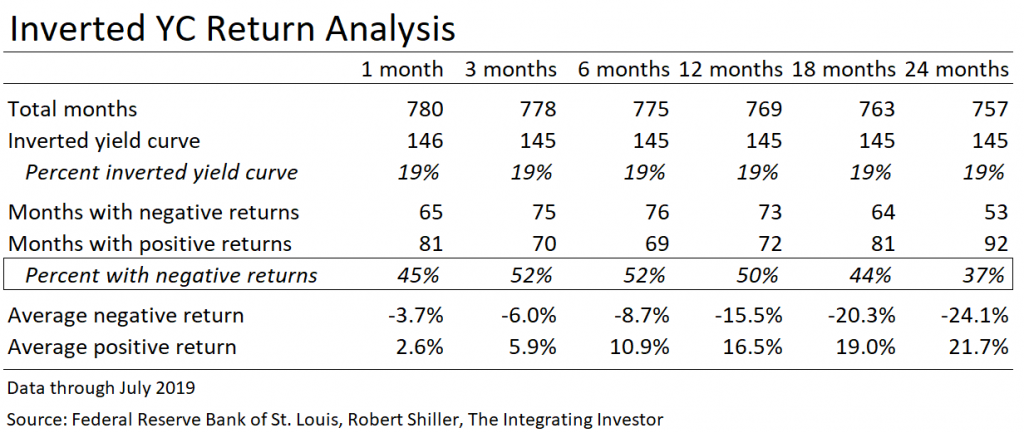
Findings From YC Data
Here is a similar table examining YC inversions. Both the instances and magnitudes of negative SPX returns appear to be higher for this data set. A base rate of 52% seems reasonable for taking a bearish stance on the SPX over a 6 month time horizon for this data set.
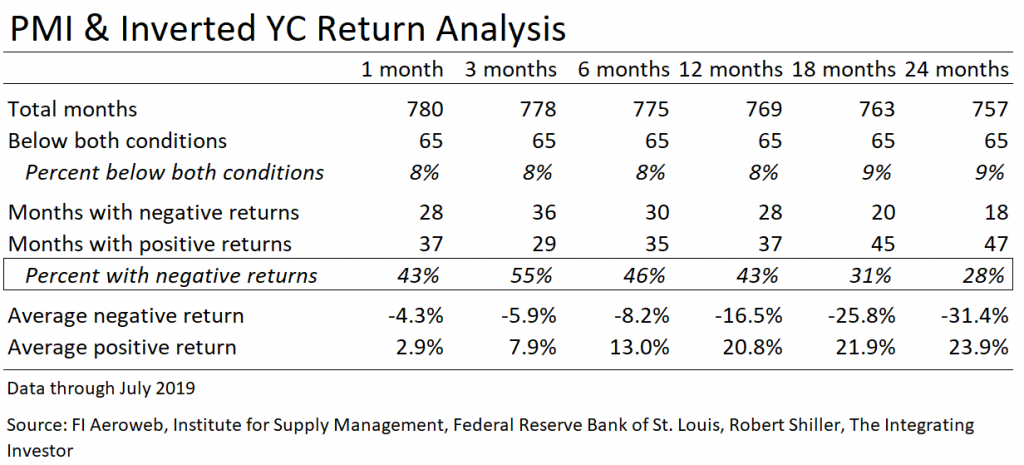
Findings From Combined PMI & YC Data
It’s an even rarer occurrence for the YC to invert when the PMI is 51.2 or below. This happened in just 65 months out of the past 780, or 8% of the time. SPX returns were negative 28% to 55% of the time depending on one’s timeframe, with 3 month displaying the highest frequency. We could use a 46% base rate for a 6 month time horizon. While losses were less frequent using this dual-signal than the YC alone, they were also more severe. Average drawdowns ranged from 4.3% to 31.4%.
Calibrating Your Grizzly
This analysis affords us two advantages. First, it removes the binary guesswork in trying to predict a recession. We no longer need to make a definite call on whether returns are likely to be higher or lower under the current conditions; we can take a more nuanced, probabilistic approach. Secondly, we can establish a starting base rate that is grounded in historical data.
According to the best practices discussed in Superforecasting this is just the first two steps in creating a robust forecast. The base rate requires adjusting by considering an inside view of today’s economic and market landscapes. It must also be updated as new information materializes.
The conditions examined (a PMI lower or equal to 51.2 and an inverted YC) were recently triggered. History suggests that we’re in a serious position. In the past, SPX returns were negative nearly half the time over the succeeding 3 to 12 months. To be sure, using just two signals is not an exhaustive process. However, it was a good first step in helping me calibrate my bearish instincts.
I’ll leave it to you, the reader, to apply your own inside view of the markets to this base rate. Ultimately, we must determine the extent to which “it’s different this time.” While forecasting is guesswork by definition, Superforecasting provided me with a useful framework to apply to all investing situations. Hopefully I’ll do so profitably.
If you enjoyed this article please consider sharing it with others.
This is really helpful in showing us how we can develop a well thought process to better make decisions. I’m going to apply this and add few more metrics and formulate points 3 and 4 fo the superforecasting characteristics.
Glad you found it useful! I highly recommend reading the book as well.
good stuff. curious to know if there is research done with lower PMI’s (50, 49, 48, 47, 46, etc). how does the data change and probabilities? i reckon the probability of a recession increase but by how much? your data and research clearly show why it is so hard to make money as a bear as your cards are truly stacked against you.
thanks for this
Thanks for your feedback. It’s interesting, the frequencies of SPX declines actually begin to decrease as PMIs fall further. This makes sense in the context of markets being forward-looking. As you point out, it shows why it’s been hard to make money from the short side.