Removal of liquidity insurance
December 29, 2019
The driving factor of Q4 appears to have been the extraordinary growth of the Fed’s balance sheet and tremendous liquidity injections provided by the Fed’s repo operations since the mid-September funding scare. In the last quarter SPX gained around 8%. I had seen a clip on twitter that said the increase in the Fed’s balance sheet in Q4 was almost identical to net issuance of treasury debt over the same period. Pure coincidence. right? I didn’t check the veracity of that claim, but the balance sheet did rise by >$400 billion in Q4. Given that it’s an election year, it’s hard to believe that the Federal Gov’t will pare back deficit spending. So the main question going forward, as we get past issues concerning turn-of-year funding, is: Will the Fed now be able to remove some of the insurance liquidity, and how will markets react?
I don’t know if one can use TSLA as a gauge for liquidity driven flows, but in Q4 it nearly doubled from 241 on Sept 30 to 430 on Friday, sparking a gain of around $34 billion in market cap. In 2019, SPX gained 32% and the Bloomberg Commodity Index (BCOM) was up 5.7%. As the chart below of SPX divided by BCOM shows, glaring outperformance of shares over commodity inputs continues uninterrupted. (Doubled over the five year time period shown). This chart rises almost as consistently as Madoff’s returns.
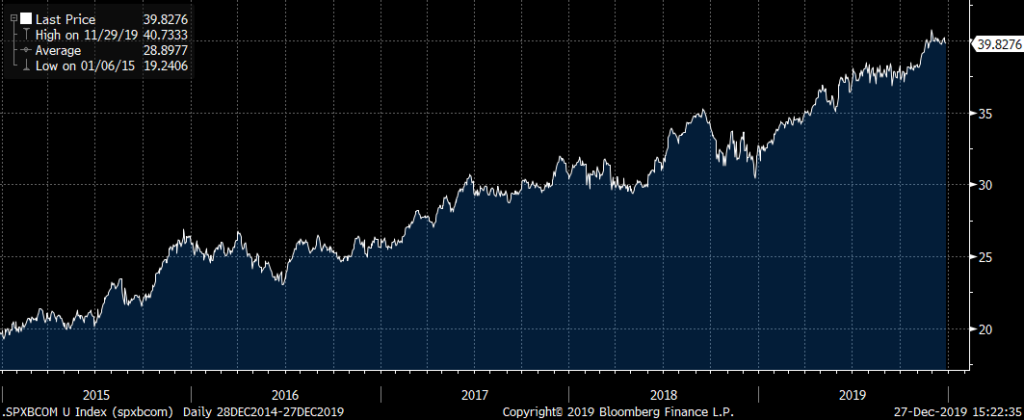
SPX/BCOM
I’ve done a bit of work on open interest levels in futures over the past year. Precious metals have recently been in the spotlight, partially due to the meteoric rise of palladium, and open interest in Gold futures (GC) continues to make new record highs. I generally think that gains in open interest confirm the major trend. However, given the myriad of gold-related derivative products, I am a bit hesitant to draw that specific conclusion. The suspicion I am beginning to harbor is that, like the repo market, for which liquidity and rate were taken for granted in spite of huge growth of assets to be funded, there may be a situation where the size represented in gold derivatives dwarfs the physical, causing a violent re-pricing.
Here are a couple of charts showing futures prices (white) with aggregate open interest (green). The top is a rolling front gold chart over the past year, while the lower chart is EDZ0 as a representative ED futures contract over the past four years. Two things to notice on the ED chart. 1) OI peaked in early 2018, after the tax package conjured thoughts of consistent growth acceleration coupled with Fed hiking, which necessitated hedging. 2) After the EDZ19 expiration, aggregate open interest has tumbled back to 2016 levels. The market is becoming convinced that no changes in the FF target are likely over the medium term, and that time frame certainly encompasses this election year.
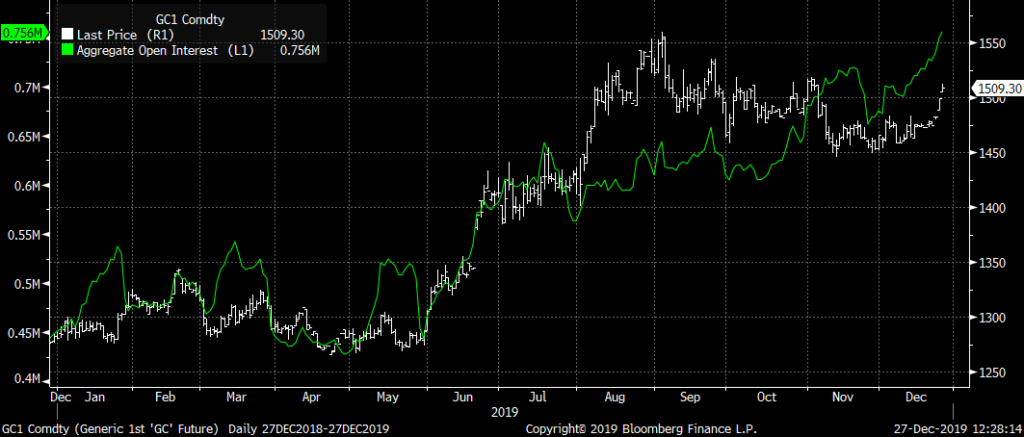
GC1 (white) Aggregate Open Int (green)
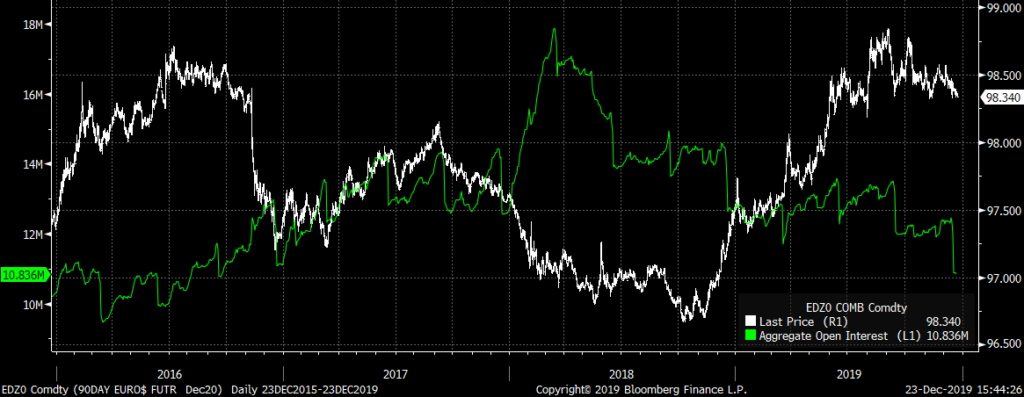
EDZ20 (white) Aggregate Open Int (green)
A few other changes are going on as well. In what may be looked back upon as a key inflection point, the collapse of WeWork seems to have changed sentiment away from unlimited funding for loss-making enterprises in the hopes of dominating market share, to more efficient operations focused on generating (gasp) profits. Second, the hike by the Riksbank this month to zero is a sign that negative rates have lost their allure. Finally, the dollar index, which has been in a gently rising uptrend for the past year and a half, now seems to be in the early stages of making lower highs and lower lows. On the whole, these developments would appear to support higher inflation expectations. 1) Shift away from buying cash-burning market share to buying profits, 2) Negative rates encourage zombies; even a small hurdle could clear out some dead wood, 3) A weaker dollar raises the prices of imports and creates better conditions for domestic pricing power.
What are the possibilities regarding a potential ‘normalization’ of liquidity post-turn? The stock market will likely have a negative reaction. In terms of bonds, the prospect of less certain funding might also stifle some enthusiasm. Though commodities could also be pressured, they will likely outperform stocks as a class.
What if the Fed finds that it can’t step back from repo operations due to fears of financial dislocations? In this case, stocks could see a more aggressive ‘melt-up’, but the dollar would likely fall further and gold would benefit.
It seems as if gold might be the safest harbor no matter was happens in the beginning of 2020.
OTHER MARKET/TRADE THOUGHTS
With Friday’s expiration of January treasury options, the large Jan/Feb call calendars are now left with long Feb calls. In TYG 129c there are 208k open, settled 25 vs 128-21. FVG 119.25c have 53k open and settled 6 vs 118-21. While there has already been some higher strike Feb call selling against these core longs, I would guess we’ll see a bit more of that this week.
Persistent skew in near ED’s. EDU0 settled 9837.0. Equidistant 9800p settled 0.75 and 9875c 4.25. There are large longs in 9875 and 9887 calls. The puts are considered trash because there is no way the Fed will ever hike (right?). That’s NOT to say that the curve can’t steepen. EDU22 settled 9836.0. In the midcurves, 2EU 9800p settled 8.25 and 9875c settled 9.75. More deferred contracts are much more open to a range of outcomes.
On Friday, pressure on near euro$ contracts abated. EDF0 jumped 3.5 bps to 9816.0 and EDH0 up 2.5 to 9825.0. Friday’s 3-month libor setting was 1.9446% while EDF0 closed 1.84%. These prices still reflect fairly high turn pressure; by the end of this week I would expect EDH0 will add to Friday’s gains. With EFFR at 1.55% and EDF0 9816.0, the spread is 29 bps, still a bit high given lack of credit concerns.
On Friday, the first April options traded in TY. TYJ 129.5/130.5cs traded 16, 500x, settled 15 vs 128-06 in TYM0. These options expire March 27. There are currently NO open April options in FV. With the roll-off of January, April and even June options should begin to see more activity. Super-Tuesday in the US is March 3rd, so if election outcomes color expectations of yields, then April options are worth tracking.
| 12/20/2019 | 12/27/2019 | chg | |
| UST 2Y | 162.7 | 158.5 | -4.2 |
| UST 5Y | 172.7 | 167.6 | -5.1 |
| UST 10Y | 191.5 | 187.2 | -4.3 |
| UST 30Y | 234.4 | 231.0 | -3.4 |
| GERM 2Y | -63.4 | -63.0 | 0.4 |
| GERM 10Y | -25.2 | -25.6 | -0.4 |
| JPN 30Y | 44.6 | 43.2 | -1.4 |
| EURO$ H0/H1 | -18.5 | -19.5 | -1.0 |
| EURO$ H1/H2 | 5.5 | 4.0 | -1.5 |
| EUR | 110.80 | 111.76 | 0.96 |
| CRUDE (1st cont) | 60.44 | 61.72 | 1.28 |
| SPX | 3221.22 | 3240.02 | 18.80 |
| VIX | 12.51 | 13.42 | 0.91 |

