About
Market Philosopher
CIO, HonTe Investments. Ran global macro at JPM. Yahoo! Finance Contributor. Ph.D. in Mathematics. Author, The Next Perfect Trade. No investment advice.
+ FOLLOW THIS TUMBLR
Central Banks and Sour Grapes
“Sour Grapes” is my response to all the complaining about central
banks (“CBs”) distorting markets, ruining price discovery, and leading their
countries into the hellscape of negative real rates.
Indeed, if global financial markets were a palace, the floors
would be sparkling clean: the central banks have been using their
counterparties as a mop for almost a decade.
Imagine this….
You are a monopolistic issuer of a product with nearly zero manufacturing costs, i.e. fiat; and everyone wants to buy this product.
In fact, they are giving you real assets in exchange for it!
Your only worry in this dream-like scenario would be that at some point the market is oversaturated with your costless product and its value collapses, i.e. hyperinflation.
However, it doesn’t collapse!
And then it doesn’t collapse some more, and then some more, and over time you accumulate trillions in real wealth on your balance sheet, which was funded by the fiat you issued at the interest rate you controlled.
….
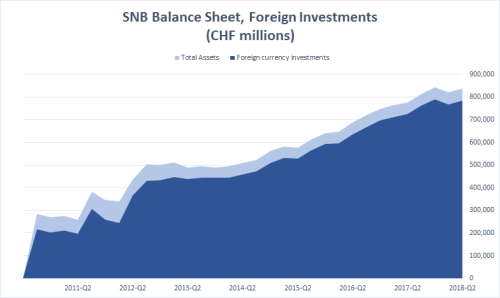
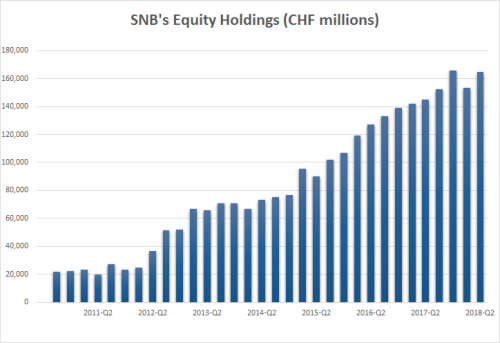
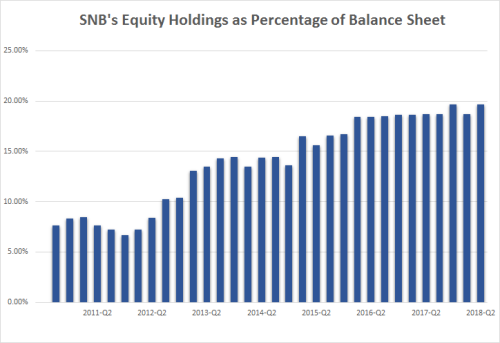
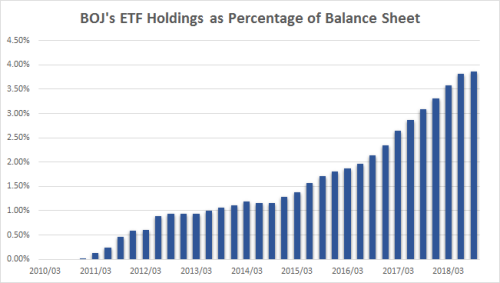
This is not fictional. The Swiss National Bank (“SNB”) has managed to accumulate a huge fortune in foreign equities by printing Swiss franc, of which the world doesn’t seem to have enough.
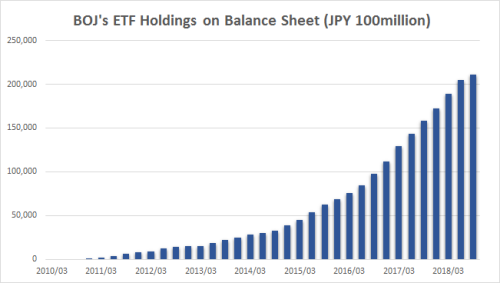
The Bank of Japan (“BOJ”) and the European Central Bank (“ECB”)
have also been voracious buyers of corporate securities.
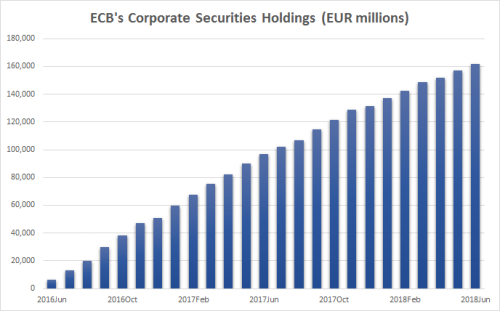
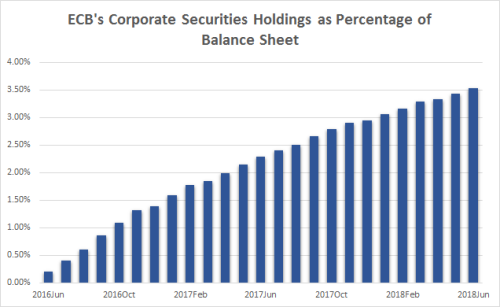
*Only includes Corporate Sector Purchase Programme (CSPP) of Asset Purchase Programme (APP).
In the case of the Fed, one can argue that all they are doing is
exchanging the spurious dollar fiat for the equally spurious US Treasury (and
mortgage-backed) paper. Spurious or not, the Treasury has managed to fund the
fiscal expansion and many real-world expenses and projects, both useful and
otherwise.
And then during quantitative easing (“QE”) alleviated the burden of outstanding debt in several ways:
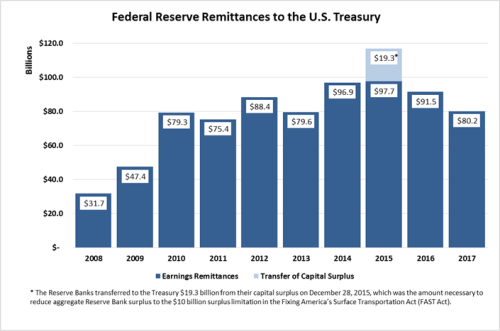
- For years, the Fed paid just 0.25% on excess reserves and
was able to fund the bonds and remit the coupon proceeds to the Treasury. Such
remittances added up to $80-100bln a year (see Fed Remittances below).
- QE (arguably) kept the interest rates lower allowing the US
to pay less interest on the new Treasury issuance.
- QE pushed inflation incrementally higher, (also under dispute,
but somewhat likely given simple demand/supply considerations) driving the real
cost of borrowing even lower. In fact, negative for a long period of
time.
- Possibly improved tax collection, as corporate profits were
aided by the lower interest rates and mortgage interest deductions were
lowered. At the same time the opposite side of this equation - interest
collected by savers - may be mostly tax sheltered in retirement accounts. Note:
A lot of maybes here, as I am not sure of this math.
I am not mentioning any benefits from domestic currency weakness
caused by QE given that with all major developed market central bank’s
simultaneously engaging in QE, this is presumably a zero-sum game.
At this point some readers are probably eager to assert that, while the central banks have been presented as omnipotent thus far, their comeuppance is imminent. In fact, many market participants adhere to the belief that global fiat collapse is now unavoidable and hedge their risk by stockpiling gold and cryptocurrencies.
In my view, while fiat collapse remains an existential risk to the global financial system, the current evidence points towards the opposite. We are not faced with the question of whether the world will absorb the increasing supply of cash; the world did absorb it. And the central banks, who have managed to sell it, are now armed to the teeth to defend it.
Indeed, if, as in the case of the USA, cyclical inflation raises its head and the economy appears in danger of the overheating, central banks can simply start buying their fiat back. Or, in other words, reduce their balance sheet – which is exactly what the Fed is doing with quantitative tightening (“QT”)!
In this process, the assets on the CB balance sheet become exactly what they are called….ASSETS.
These assets can be and are used to defend the credibility of fiat by giving it a consistent bid.
Furthermore, if, in cases such as Switzerland or Japan, the domestic currency was to suddenly spiral down under the weight of increasing monetary base, the CHF and JPY could be defended by selling foreign assets.
On the flip side, the ownership of domestic sovereign debt by the CB can be used to mitigate excessive currency strength and a deflationary spiral as well. The BOJ, ECB, SNB and Fed all have the ultimate stop-gap of full or partial debt jubilee as described by David Zervos in his “Bondfire of the Vanities” discussion.
Some of you may have noticed, that there is one scenario none of the above measures would help with…Stagflation.
Personally, I am inclined to believe that stagflation is a mythical creature, or at least an urban legend.
I know, I know, there are historical examples. (Wait, are there?).
But looking back through my couple of decades in financial markets, everywhere I turn I see robust growth and moderating secular inflation. The opposite of stagflation.
Of course, it is possible that the end of both the secular trend of disinflation and the secular bull market in sovereign debt is here and now. But I just fail to see the evidence.
Inflation remains moderate, despite a quite prodigious effort to inflate DM economies. And where, like in the USA, cyclical inflation becomes a threat, the policy quickly gains traction and flattens the yield curve.
And this is all happening in an environment of a very long economic expansion. Why should I believe that inflation will become a threat in a downturn?
Suppose I am wrong. I still struggle to see how the Fed’s large balance sheet is a problem.
It is a problem if you are forced to sell assets when their prices are going down. But central banks are never forced to sell, because they control the funding.
In the hypothetical stagflationary scenario, the CBs will have a range of possible policy options. They, for example, can choose to keep rates very a low (even negative) to ameliorate an economic slowdown and reduce their balance sheet to support domestic currency and mitigate inflation.
Notice the Fed started to do things in the opposite order (e.g. hikes first), because stagflation is not a current concern.
All of those arguments are based on the assumption that central banks are run by intelligent people invested in the long-term prosperity of their country. Some readers may take an issue with this assumption and if you feel inclined to have your views swayed by this post, I would also recommend reading Fed Up: An Insider’s Take on Why the Federal Reserve is Bad for America, where Danielle DiMartino Booth presents a very different perspective.
The question of benevolence of the CB policy ties to an inquiry: who are the aforementioned hapless counterparties? Are they just reckless hedge fund managers going short US Treasury bonds or stocks? Or, are they the domestic savers, including pension funds, who are deprived of yields? Or even the millennials staring at the absurd housing prices and the absence of ways to build wealth? Or maybe the 99% watching global monetary flows slip between their fingers and stream into the vortex of economic singularity?
Preferring to keep the discussion strategic rather than political, we still have to confront the trope of central banks being run by clueless academics. Academics tend to be bright and open-minded by virtue of being academics. Sure they don’t have a good grasp on how the real markets operate. But neither does everyone else, including economists, strategists, financial advisors and journalists, politicians, entrepreneurs, and corporate executives. Anyone without experience as a global macro trader, who must contend with interconnected financial markets, is comparable to a general who has never fought in a war.
Yet, some generals trained in peacetime have done well. And those “clueless academics” pulled off the greatest coup in financial history.
It is my belief that QEs were genuinely intended to, and succeeded remarkably at, promoting the wealth of their respective nations. Any disappointment in how this extra wealth ended up being distributed is neither strictly within the purview of a central bank nor within the scope of this post.
From a strategic perspective, I am only disappointed the Fed didn’t cut rates much faster in the end of 2007, didn’t start QE earlier in 2008, and, more importantly, didn’t pursue an even more immense and broader scale of purchases. Stronger and quicker action may have ameliorated the Great Recession, but even if it were ineffective, I don’t see how it could have been detrimental to the recovery.
This relatively trivial critique only confirms the success of the CB strategy: of course, no matter how much of a profitable trade you put on, you end up wishing you had it in a larger size.
It’s possible to debate whether the trading success of the CBs can be evaluated on the same scale as that of other market participants. On one hand, the CB buys and sells at market prices as everyone else, and their product, fiat, is transparently presented. On the other hand, they are embedded in their government, flanked by politicians, the military, and law enforcement who protect their credibility.
Fair or not, one has to play the hand they are dealt.
And the central banks are not just playing the game well….THEY HAVE ALREADY WON!
Good luck,
In Quest for Digital Gold
How did gold become gold? And, more importantly, why is gold staying gold?
Silver had its run during some periods and in some cultures, but silver has become “tarnished” as a store of value.
Gold meanwhile has survived the rise of fiat and major economies moving away from the gold standard. It has also survived the loss of its utility as a convenient medium of exchange.
Certainly, gold has demand from the jewelry industry and some industrial utility. But this “natural” demand is not even a close match for the existing above-ground supply. Imagine what would happen to the price of gold if all the metal in the vaults (owned by central banks or other hoarders) were to be sold.
And yet the value holds. Significant fluctuations for sure, but in the long run, it remains stable.
I am not an expert on the history of gold. To the best of my understanding, precious metals were chosen as a medium of exchange because they do not oxidize easily and remain in an uncorrupted form. They can also be traded purely by weight and are preferable to gems, which have value heavily dependent on their shape and quality.
Amidst precious metals, however, gold is neither the rarest (platinum and palladium are harder to come by) nor quite common, like silver. Gold has solid but by no means exclusive, industrial or jewelry related demand.
My guess is that over many centuries, the precious metal has hit it’s “golden” mean; it is common enough to be a worldwide currency, but not so common that mining can disrupt its price. It is useful and decorative enough to support some underlying value, but the supply is not so tight that marginal swings in demand would create wild price fluctuations.
My assumption is that through those subtle advantages, gold has simply outlasted its competition. And, as a result, it has gained so much credibility over millennia that its value can no longer be diluted or displaced. Today, gold (XAU = $1,275) is more expensive than platinum (XPT = $915) which is much scarcer and as useful in an industrial sense.
That said, you may have guessed by the title that this post is really not about gold, but about digital assets. Until recently, I was thinking of the dichotomy between the precedence of bitcoin and the advantages of alternative protocols. I am realizing that this dichotomy may be false.
If a universal digital store of value (“digital gold”) is to be established, it doesn’t by any means have to be, and not even likely to be, the universal medium of transactions; a fortiori, it is not likely to be a universal conduit for transactions.
Bitcoin is battling to become digital gold, while ether, for example, is elbowing to become digital copper. If the analogy holds, the price of ether will be driven by technology demand, while the price of bitcoin by the need to store liquidity. Will bitcoin cash be digital silver?
As a corollary, the rise of altcoins geared towards specific purposes is not at all dilutive, but actually supportive of bitcoin. While diminishing its share of trading volume in actual transaction flows, it shields bitcoin from being demand driven and makes it a more attractive store of value.
Now, to assess the future value of bitcoin we need to answer three questions:
I. Is there a need for digital gold?
II. Is bitcoin more like gold or more like fiat?
III. Why bitcoin specifically?
I am not going to spend time on question one; I assume that my readers appreciate the advantage of having digital value storage and I have nothing to add to the already existing discussion.
Regarding, question two, we need to address the issues of altcoins and forks. I have already explained why I think altcoins are no more dilutive to digital gold than platinum or palladium are dilutive to physical gold. And if physical mining for gold is alive and well, so will be the digital mining for digital gold.
Forks are a trickier issue because they cause many to liken a crypto-asset to fiat, and the community of miners to central bankers. So, are forks inflationary (and for the purposes of this post I use the example of recent bitcoin hard fork)?
One definition of inflation is “the tax on capital”. It describes what happens to the purchasing power of your asset if it just sits there doing nothing. Therein lies the distinction between bankers printing more money and the blockchain forking. New fiat does not go proportionately to the holders of existing money; rather it goes where the government directs it (some cynics seem to think it tends to end directed to the richest of us) via specific asset purchases such as QE or via targeted fiscal stimulus such as tax cuts or increased spending. While those things are happening, your savings may indeed be eroded.
But the hard fork gave each current holder an extra asset. Theoretically, it is a zero-sum game, but like just like stocks tend to react positively to a stock split, this particular fork went well for the asset owners. For what it’s worth, I think the fork was more like a dividend than like split, but this is not the most relevant debate here.
I think it is obvious that forks do not TAX the capital of current holders. A more interesting question, however, is posed by forward contracts. If I promised you delivery of a bitcoin on July 1st, 2017 or September 1st, 2017 this contract may have had a different value depending on how it was written. Forward stock value, for example, dips down on the ex-dividend date. From my perspective, therefore, it is not so much an issue of forks being inflationary, but the necessity to program blockchain contracts carefully.
If the government one day announced that every dollar is to be exchanged overnight into ten dollars it would not be inflationary in itself because the purchasing power of existing money wouldn’t change. But it would be important to know what happens to existing contracts and liabilities. If you have a salary or pension guarantee, does it go up 10 times? What about debt payments? If it is all done proportionately, there is no economic impact. But if it’s done selectively a wealth redistribution could happen.
Lastly, why bitcoin specifically? It has been discussed ad nauseam why bitcoin mining qualities and limited supply gives it aspects similar to gold. But its unique advantage with respect to other crypto-assets is that was there first. And now it is in the process of outlasting the competition.
When bitcoin first started trading, I was mostly unaware and fairly agnostic of its value. As a trader, I became interested in its vertical rise in 2013 which was followed by a bear market in 2014. Notably, its drop found support; it didn’t continue to fall to permanent obscurity below the event horizon. Instead, it stabilized, put a solid double-bottom in 2015, and started to creep up.
XBT, Oct 2012-Oct 2016
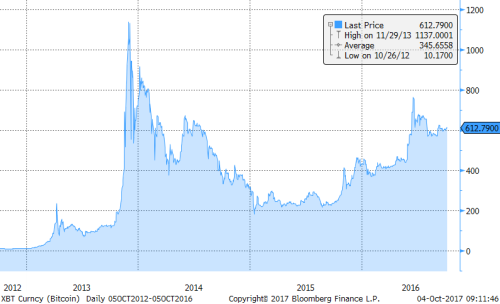
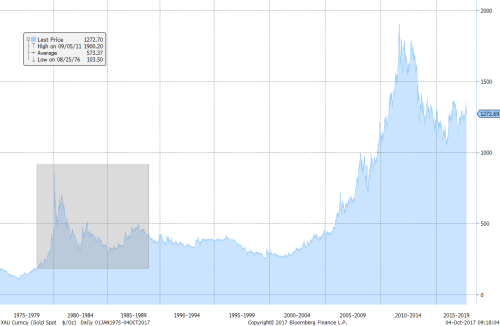
This trading pattern is consistent with precious metal behavior, only compressed to a shorter horizon. For example, look at the slow consolidation in gold after the spike of 1980.
XAU, 1975 - Present
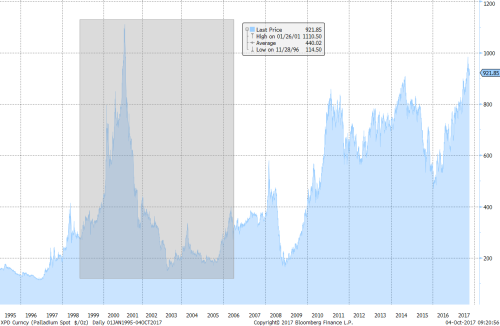
Or, more recently palladium after the spike of 2001.
XPD, 1995 - Present
Given the historical trading pattern in precious metals, the buy of bitcoin in 2015 was relatively easy. But now, at 20X (including fork) the early prices, it is a more complicated trading dilemma. Bitcoin may or may not be a “bubble”, but it is important to remember that it did have a major “burst” in 2014 and, even this year, the market has witnessed bitcoin endure two meaningful corrections.
XBT, 2017 (Actual price swings were even wider than BBG-sourced data below)
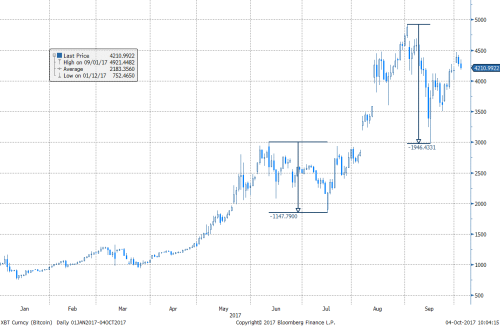
And every time it survives and stabilizes, it gets extra “gold cred”.
In summary, despite the rise and fall of various alt coins and fork considerations, “time” works FOR bitcoin, not AGAINST it. Every day it doesn’t disappear, it gets one step closer to a permanent status of digital gold.
Good luck!
Entering the Kyle Bass US Yield Curve discussion…
I greatly enjoyed watching Raoul Pal’s latest interview with Kyle Bass, entitled “Tipping Point for China” on RealVisionTV. While my eagerness to hear the discussion was rooted in hearing Kyle’s current views on China, many other ideas and subjects surfaced as always happens during such talks.
In particular, the shape of yield curves in the developed markets caught my attention. Kyle was concerned about the supply shock of bonds which would be caused by the Fed unwinding its balance sheet and by the ECB tapering. This led him to expect higher long-dated interest rates and a curve steepening. Interestingly; Raoul emphatically agreed with the steepening bias, but his motivation was that he expected a deflationary rollover of the economy and an imminent easing in the front end.
I find myself unable to resist the temptation to wade into this debate. First and foremost, the US yield curve has been flattening, flattening, and then some more flattening. Why? Well, there are a few completely unambiguous lessons I have learned over my 20 years in the market, and one of them is that the hiking cycle equates to a flattening curve. Flattening starts before the market anticipates it; and flattening goes on for longer and deeper than one would expect. Flattening in every portion of the curve even where economically it doesn’t make sense. Flattening, period.
US 2s-10s vs FF, Jan 1999-Present
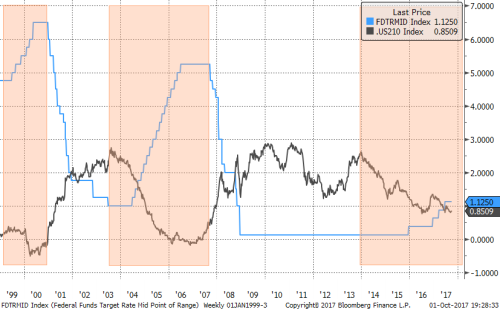
Raoul’s point is exactly the opposite side of this coin; easing means steepening. And you can easily see it on the charts above immediately after the orange-shaded boxes. I don’t have any proprietary way of estimating how soon the easing may come, but it tends to arrive sooner than expected, in fact, on average only a few months after the final hike of a cycle.
I am tempted to argue “this time is different”; current front-end rates are low enough that scope of a steepening rally may be limited by the zero rate (or small negative) bound. But this seems intellectually inconsistent after my flattening spiel.
Even assuming I accept that easing equates with steepening, until proven otherwise, I am left with the dichotomy between the observable fact of the current hiking cycle and the speculation about the future easing cycle.
An even more complex dilemma that bond bulls, like myself, have to face is the specter of the QE/balance sheet unwind. Kyle brought up the supply shock worry that is expressed by many. In fact, there is an opinion out there that developed market sovereign debt is a huge bubble propped up by Central Bank purchases and is bound to implode in the near future. And while I generally disagree, I can’t deny the risk is real and material.
As I speak of the reasons why I hold a different conviction, I want to point out my arguments mostly pertain US Treasuries (“USTs”) and, to some extent, Japanese Government Bonds (“JGBs”), but probably less so to European sovereigns, which are idiosyncratic.
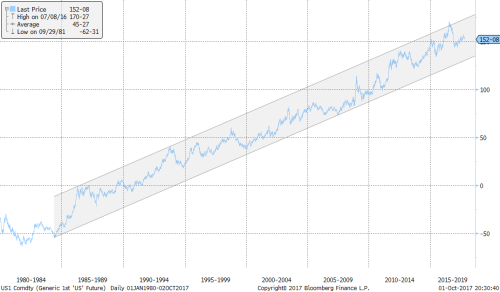
I. The secular total return bull market in USTs started decades ago and has not changed its shape, pattern, or velocity with the advent of QE and tapering.
US Long-Bond Futures (Total Return Chart)
II.The demand for USTs appear to be extremely elastic, making a supply shock unlikely. Furthermore, USTs are an asset and they don’t dictate the overall level of interest rates. At most, supply/demand can push swap spreads up and down. To illustrate the point, remember “the vanishing Treasury supply” in the Clinton Era.
Well, in the middle of all the repurchases, the 10 year rate peaked at 6.78% in 2000. Swap rates were even higher on a relative basis with the 10 year swap spread blowing out to 138bp four months later during the same year.
US 10yr Yields vs US 10yr Swap Spreads, January 1999 to December 2000
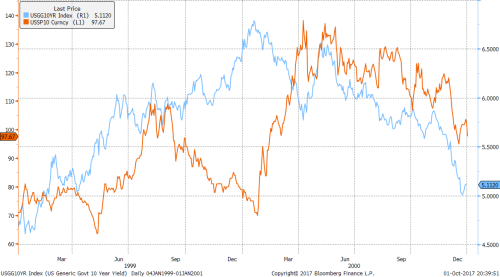
Meanwhile, all the debt expansion of the recent decade along with the tapering of QE didn’t stop rates from falling to the lows of 1.35% in 2016. And swap rates overshot the downside with the spread touching -0.18% (negative!) in November, 2016.
Of course, there were other forces involved including an obvious negative correlation between economic growth and Treasury supply (Keynesian fiscal policy). Still, it is very hard to argue that UST supply drives US rates.
III. From an economic perspective, balance sheet (“B/S”) unwind is unequivocally bullish for USTs. A similar argument can be applied to a hawkish short-term rate policy; it achieves economic slowdown and lowers inflation expectations. However, B/S unwind is even more positive because it accomplishes a tighter money supply without actually increasing the cost of carry for long-dated bonds. One could argue that the economic argument may not matter if there is simply more sellers than buyers, but for this, I would refer again to point II. Short-cycle gyration of the long bond prices can be quite vicious, but the economic gravity tends to win.
To summarize, a new easing cycle is something to deal with when it arrives and the supply shock is something worth fading, but not without peril.
Good luck,
Alex Gurevich
When can traders out-economize the economists?
In both my public comments and investor correspondence, I have been consistently emphasizing the importance of separating expert opinions from layperson’s hunches. Applying this advice to myself, I try to rely on my strategic edge rather on my economic forecasts.
In fact, taking this point even further, I don’t rely on anyone’s economic forecasts. But it is not because I consider the analysts who produced those views incompetent. Indeed, there are those with intellectual frameworks I highly respect. Still, for every well thought-out argument, there is an opposite one equally well-substantiated.
Current US economy and stock market bulls and bears are a great example; both camps have excellent charts, statistics, and qualitative opinions. When two experts I respect disagree so strongly, I have no choice but to believe the future is uncertain. And forecasts from either side have little value other than establishing a paradigm.
So are there times when traders can see something economists do not? The jury is still out on this one. I’m convinced more often than not that market professionals delude themselves by thinking their hunches regarding a particular unemployment number or inflation statistic have predictive power.
But I believe there is one area in which traders may have an edge: we tend to have a strong sense of momentum. While the analysts measure where things are, traders think in terms of where things are going. Thus, when a business cycle turns, traders may have a stronger strategic commitment to a nascent economic trend.
I will not use the cycle turning of 2007-2008 as an example - it was too unusual. But I remember well 2000-2001. The NASDAQ index started to collapse throughout 2000, while the Fed raised rates 100bp in the first half of the year and kept them flat at 6.5% for the remainder of the year. Only towards the end of the year in 2000 did the Fed begin to initiate mild talk of a potential economic slowdown.
NASDAQ vs FED Funds Target Rate, 2000 - 2003
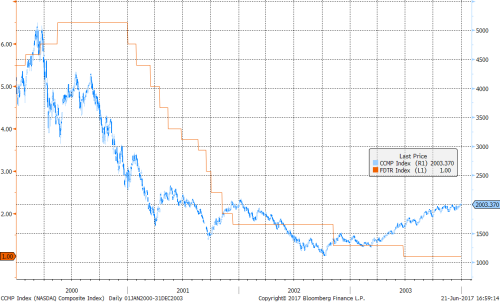
To be sure, the central bank accepted recession being a real risk early in 2001 and started cutting rates aggressively. But not aggressively enough even though we in the trenches were quite sure that the dot.com bust was leading to the inevitable recession and a much deeper fall in interest rates. For the younger market participants, I will remind that the recession was not caused by September 11th. It was a virtual certainty months before. I even suspect that the terrorist attack, in fact, accelerated the recovery by forcing the Fed to ease even faster and by bringing stimulus into the economy.
I remember that sense of confidence: “blah blah blah, whatever the research says,” the rates are going down! Of course, for every time one could have been right this way and made a fortune, there could be several false starts; traders reading too much into a transitory data shift. I cannot prove or disprove the value of this momentum sense. I am just bringing it to your attention and judgment.
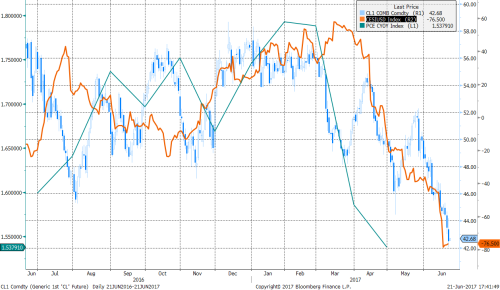
Why am I writing about this today? Over the last few weeks, my momentum sense started to tingle. The recent fall in oil prices and core inflation together with other incrementally soft data are beginning to signal the roll-over of the cycle and the bond markets are running with it. Meanwhile, the analysts are still vigorously debating.
Crude, US Surprise Index, Core PCE (y/y), June 2016 to present
To re-emphasize: my bullish bond position is not contingent on this current perception but on my strategic framework which is independent of forecasts. The cycle does not have to end today, I can wait to make money tomorrow.
But I can’t help having a hunch - value or no value.
Good luck,
USDCHF - A French Election Trade
Market
participants, remembering the impact of Brexit, have their focus on France this
weekend. The last thing I want to do is add into the
mix my futile hunches regarding the probabilities of various winning candidate
permutations. Furthermore, wI won’t even speculate how the market will react to
any particular second round match-up.
The purpose of
this note is to discuss a rare, tactical conviction over this weekend.
Staying COMPLETELY AGNOSTIC as to whether the election outcome will be taken as
Eurozone positive or negative, consider USDCHF.
Scenario I
The outcome is
perceived as negative; fueling French EU exit fears (‘disenfrancising’) and
risk-off trades such short USDJPY, short equities, and long US Treasury bonds
are expected to benefit. EURUSD is likely to fall and underperform CHF.
However, given the close linkages, CHF is likely to be dragged down by the EUR
and, unlike JPY, underperform the US dollar. So, in this scenario, we expect
USDCHF to gain.
Scenario II
The outcome is
perceived as positive; risk-on trades, such as long equities, are expected to
benefit. US and European risk-free rates are likely to trade higher. EUR
will likely outperform CHF and possibly by a lot, as Swiss interest rates are
more pinned, and USD will rally against safe harbor currencies such as JPY and
CHF. So, in this scenario, we expect USDCHF to appreciate.
To re-cap, USDCHF goes up, or USDCHF goes up.
It is important to underscore that when I talk of tactical conviction, I don’t mean “I am positive that this trade will make money,” rather I mean “I am convinced that this is a positive expectation trade.”
Markets are finicky, and even with the logic above I can assign no higher than 60% chance of being correct.
And we I am fully prepared to be completely wrong.
Hence, I am purposefully posting at the end of the trading day not to entice the reader to follow our trade, but to share and “timestamp” my thinking, which typically applies to the long investment horizon, but in this unique case may have a short-term value.
Good luck this weekend!
Not Forecasting 2017
Year end is a sweet time for bashing forecasters. Many investors take a savage delight in pointing how comically off particular economists or analysts were on this or that price, or event, in 2016. And then, without hesitation or irony, they proceed to read the forecasts for 2017.
Yogi Berra and others have said:
“It is difficult to make predictions, especially about the future.”
But instead of making light of forecasters, I will briefly discuss some limitations of using forecasts for trading.
There is a fundamental difference between analytical and strategic thinkers.
- Analytical thinkers focus on facts and evidence; partitioning or breaking down information into mutually exclusive categories with a goal of generating a solution to a problem.
- Strategic thinkers design systems of responses to various future situations, foreseen and unforeseen.
A great macro trader should at least be decent at one of those and a genius at the other.
I have always balked at questions such as “Where do you see the Euro at the end of the year?” Somehow even trying to think in those terms annoys me. In my book (Chapter 7), I advise specifying one of two features for every trade: time horizon or price target. Trying to do both seems too arrogant.
But forecasters are not stupid; they know the future is uncertain, but they are given a problem and need to come up with a number (e.g. GDP, exchange rate, election outcome, etc.). They are paid to deliver a prediction, and they do their best.
I. The first and simplest forecasting problem is determining the difference between the Expected Value (EV) and the most likely outcome.
The most likely outcome is what I call the “Central Scenario” - the direction things are heading if everything plays out most or less as expected (it rarely does!).
For example, a few months ago we could have correctly forecasted a single hike by the Federal Reserve that occurred in December.
The problem with the Central Scenario is it does not express in which direction the market is more likely to stray. This problem has been a fundamental issue, for example, with the continuously mispriced interest rate curve. For decades, both interest rate forwards and economists perpetually overestimated the average level of interest rates over any meaningful period.
For some charts and numbers, look up Chapters 2 and 3 of my book.
Over the last 40 years, short-term interest rates have exhibited a much stronger propensity to move dramatically lower than higher due to an exogenous event such as the Russian debt crisis, 9/11 or the Global Financial Crisis. To put it, in other words, there are surprise eases, but not surprise hikes.
It is not difficult to see how, over the long run, the outcome favors the bond bulls.
It is important to understand that forecasters are likely to aim for what they think to be the Central Scenario as it maximizes their chances of actually being close to right.
By way of example, consider the extreme case of betting $1 on “tails” on a coin toss. The tail-ish economists will forecast a $1 gain, while the heads-ish ones a $1 loss, both hoping to be right more than 50% of the time. But those who forecast $0, have no chance to be right!
Critically, it is up to traders to understand the paradigm and maximize the value of their portfolios.
II. The more subtle and pernicious problem has to do with creating a variant forecast.
So far we haven’t considered the divergence between forecasts and market forwards. But for a trader, only a variant view is of any value. If there is no such divergence - there is no trade.
Now an analyst trying to forecast, say, the year-end level of EUR/USD would have to deal with multiple moving inputs such as equities, interest rates, and commodities, not to mention geopolitical variables. To derive a Central Scenario, the analyst will use what they think are the Central Scenarios for each of the inputs whether or not they are aligned with market forwards.
Therein lies an enormous logical fallacy that few traders in my experience escape:
Unconsciously basing positions on a forecast for one asset class, which is relying on the divergent outcome of other asset classes.
Asset class interactions are discussed in Part III of my book, especially Chapters 11 and 12, but I will give just one example here.
At the beginning of 2016, there were a number of dollar bears (or at least skeptics). But when I dug deeper into their thinking, more often than not it turned out that their dollar view was predicated on the fact that the US economy was close to rolling over and the Fed was not likely to hike again or may even ease.
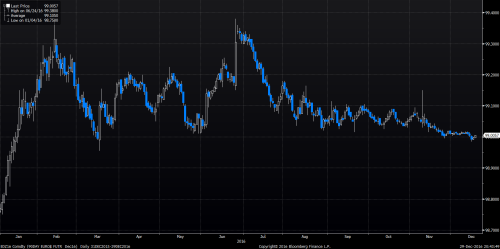
Yet, the market was predicting even more hiking than would actually happen for 2016. December Eurodollar futures ended the year far off the highs, but still higher than where it had started. And if one aligned with the earlier market forward, the dollar bearish view was unreasonable.
EDZ16 <Comdty>, 2016
I have written many times how long dollar and long bond trades have been strictly superior to their opposites.
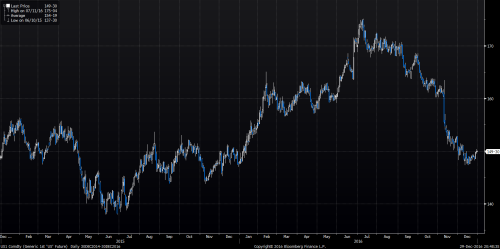
Indeed, classic bond futures have played out exactly as predicted by markets for two consecutive years (i.e. no P/L on a total return basis), in the environment of very robust job data.
Classic Bond Futures, 2014-2016
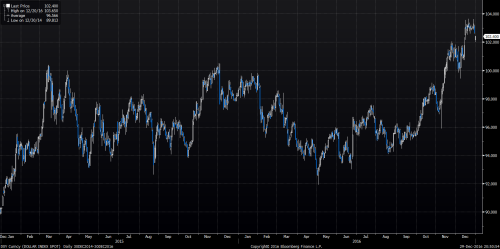
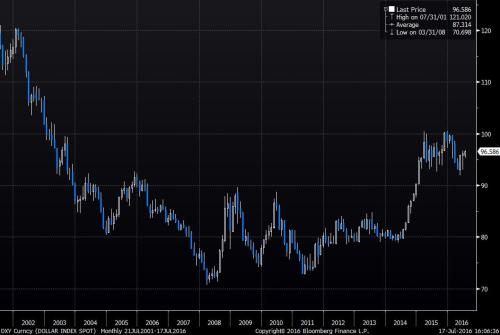
Meanwhile, the dollar index (we are charting DXY price which is conservative as dollar also has positive carry) made substantial gains in both years.
DXY <Curncy>, 2014-2016
It is not that dollar bears were wrong. We have all been both right and wrong multiple times. Rather the point is they would have done better by going to the origin of their view and being long bonds.
Good luck and Happy New Year!
Priced To Perfection?
Trumponomics
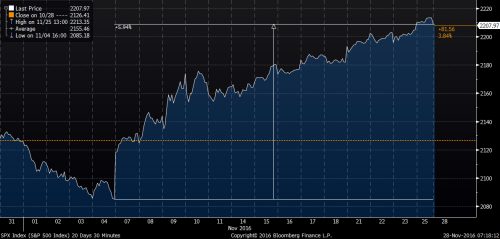
For over two solid weeks after the election, the markets have been relentlessly pricing in the success of “Trumponomics.” To be clear, we mean “success” in a purely non-partisan manner. It just means the President-Elect would accomplish what he says he is going to accomplish, whether that might be good or bad in an individual’s view. Furthermore, we discuss economic causality only to the extent it affects financial markets, or more precisely, how it defines superiority and dominance relationships between specific trades.
With
that in mind, let’s start untangling Trumponomics with its flagship item:
infrastructure stimulus. Long on the Democrats’ agenda, the package of $500bln
to $1tln is now expected to pass through the Republican Congress. Without
offering our amateur political analysis, we point out that this may or may not
happen.
By
“expected,” we mean the price action in:
- Equities;
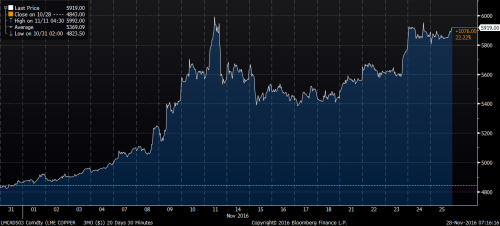
- Industrial commodities; and
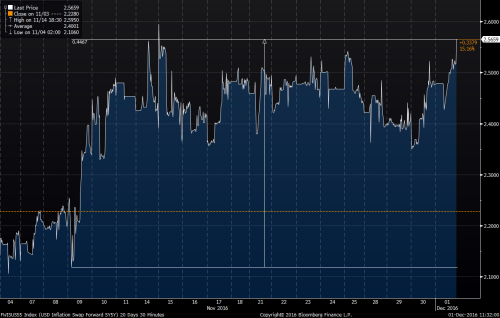
- Inflation break-evens.
Surely, if the stimulus were to pass, all else being equal, it would provide a tailwind to all of the above. But, the magnitude of the move thus far has already been substantial enough to make us question if betting against the stimulus is taking on a characteristic of an “Even If” trade discussed in Chapter 13 of The Next Perfect Trade. The argument being that there are occasions when the market pricing is so skewed towards one outcome, that betting on the opposite outcome may make money even if the most expected event comes to pass.
The recent price action in pertinent markets:
US Equities: 1m Historical
Copper: 1m Historical
5Year US Inflation Breakeven: 1m Historical
FED Response
Now let’s shift the discussion to the Federal Reserve. Should the stimulus pass, the Fed would consider the rising inflation expectations justified, based on the triple impact of:
- Rising commodity prices;
- Tightening labor markets; and
- Wealth effect from the stock market.
Importantly, the Fed was well on track to tighten imminently regardless of the election outcome, so in this case the EVEN IF trade points us in the direction aligned with Trumponomics. There have been debates on whether the current Federal Reserve is too tight or too easy. We elected to stay on the sidelines but consistently highlighted that the Fed is indubitably hawkish relative to other DM central banks.
Though
Trump criticized Yellen during the campaign, we are not sure how much of that
was purely political rhetoric, and what he would rather she do or not do. What
we know is that Ms. Yellen is likely to stay on for the remainder of her term
and to pursue her policy framework. As for what
comes after, we would posit that the President-Elect has a good understanding
of debt and interest rates; he would likely “push” for a policy that would
neither stifle the economy through excessive hikes nor allow inflation
expectations to run away leading to a catastrophic steepening of the borrowing
curve.
We
pointed to the limitations of the curve shape as a leading indicator in our
post, Flat
Curves & Recessions, from September 28th, but steepening is
often viewed as a good thing as it is associated with periods of solid economic
growth. On the other hand, as the United
States has a considerable current account deficit, higher rates are net
negative for the wealth of the nation (more interest going to foreigners), and
this is something Trump may be aware of.
Overall,
we see no reason for the new administration to nudge the Fed to one extreme or
another, so ‘business as usual’ is our best guess.
What Does This Mean for The
dollar?
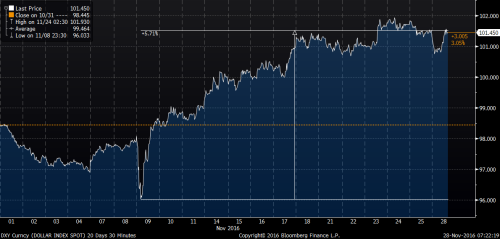
The
US dollar (USD) has strengthened a lot on the back of Trumponomics. This price
action is consistent with the notion of a
reasonably vigilant Fed, which would raise REAL interest rates in response to
higher inflation expectations.
USD: 1m Historical (DXY)
Recent re-price of the markets notwithstanding; we continue to maintain that stronger dollar is a concurrent necessity with respect to higher interest rates. In other words, if US rates stay where they are or move higher, the USD should continue to perform well on a total return basis. For those who feel that the dollar rally has gone too far, we would refer to our post from March of this year and point out that given the rates differentials, the current 10-year forwards in EURUSD, USDJPY, and USDCHF are 1.3150, 84.00, and 0.7500, respectively.
As we have long noted, ECB, BOJ, and SNB do not have to ease further to weaken their currencies; all they have to do is to hold steady and let the Fed lift off.
Most
dollar bears base their view on the implicit necessity of the US rates playing
out much lower than currently projected. Our logic then dictates that betting
on lower rates is the dominant trade.
Let’s
Talk About the Transmission Mechanisms
Higher
rates and stronger dollar traditionally are seen as a recipe for a deflationary
slowdown.
As
an aside, we acknowledge the point of view that in a stronger final demand
environment, higher rates may, in fact,
be inflationary as they increase the production costs. We, however, stick with
the simple perspective that real rates are “the cost of money.” And if the cost rises, well then money
becomes more expensive, i.e. deflation. Of course, a further nuance may
be possible arguing that higher rates are mostly deflationary for asset prices,
not consumer goods - a theory well supported by the fact that recent low rates
have helped asset prices much more than wages.
We
are acknowledging those arguments to emphasize serious uncertainties and
complexities in the rates mechanism, but we will stick to the simple
observation that “too high rates” typically lead to a collapse in the stock market, which is often followed by an economic slowdown.
We
have long argued for the negative predictive power of interest rates and that
perpetually upward sloping and steep
yield curves, provide a tailwind for the secular bond bull market.
The
dollar rise should be even less controversial, as it incrementally leads to
weaker exports and lower imports prices.
So,
on an “all else being equal” basis, the recent shift to higher rates and stronger
dollar equates to a tightening monetary condition and should lead to lower
inflation expectations, a flatter yield curve,
and lower equity prices.
This
transmission mechanism is challenged by
the market’s acceptance of the Trumponomics. The higher rates would be offset by the stimulus and the impact to trade from a higher
dollar by import taxes. Tariffs being another “may or may not happen”
proposition. We will not even go into
the risk of a global slowdown caused by potential
trade wars.
It
is sufficient to say that the tightening of economic conditions is present here
and now, and stimulus and tariffs are
something that might happen in the future and just might have the expected
effect.
As
you may guess, we continue to argue for
our portfolio strategy; a combination of long US bonds and long US dollar
against DM currencies.
When
addressing bonds, it is important to
mention the credit risk which may increase
with Trump’s potential expansion of the budget deficit and his rhetoric,
however unlikely, regarding a “workout” on the US debt.
Long-dated bonds have cheapened significantly
over the last few days on an asset swap basis, some of them approaching the
level of Libor + 60 bps. Some have viewed that relationship as mathematically impossible
and attribute it purely to technicals related to the Dodd-Frank limitations of
balance sheet and foreign CB selling.
As
we wrote in a blog post a year ago, it is not exactly as simple as that.
However,
setting technicals aside, the only economic justification for the current levels is the pricing of at least 100bps of credit risk. This, in itself, implies something like 80
cents on the dollar workout on long-dated
bonds, which in our view is extremely conservative.
There
is no doubt that the Trump victory has introduced more uncertainty into the
rates environment, but we are well compensated
for this. For example, while we would
rather be long bonds with Clinton than with Trump at the same level, we prefer
to be long bonds with Trump for an extra 100 bps.
And
finally, for what it’s worth, both the magnitude and velocity of the recent
correction are entirely consistent with
multiple, recent corrections including:
Long-Bond Futures: Corrections of 1994,
‘00, ‘02, ’06, ’09, ’11, ’13, ’15, ‘16
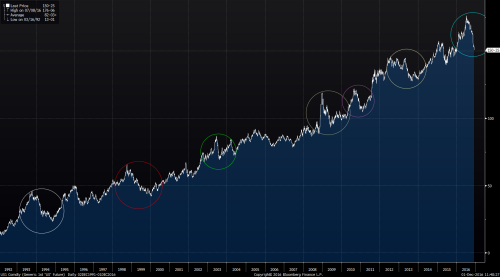
For now, the One Chart still rules them all.
Good luck!
Flat Curves and Recessions
All too often I hear sentences like “The bond market and the stock market say opposite things about the economy” or “A flat curve means recession, so if you expect the curve to get flatter that means you are expecting an imminent recession”.
The purposes of this post are to dig a little deeper into the concepts of concurrencies and causality associated with the yield curve and to challenge some of the common assumptions embedded in the statements above.
While the “Freakonomics” crowd loves debunking confusion between correlation and causality, I will instead write in terms of the distinction between “causes” and “indicators” and, furthermore, between “leading” and “concurrent” indicators.
My strategy mostly deals with causes. In my book, I discuss how causal relationships between two market events can be characterized in terms of necessity and concurrency and how to trade based on such characterization.
By way of example, the Fed moving to tighter monetary policy has a clear causality relationship with a stronger dollar and a flatter US yield curve. As always, some would disagree even with this paradigm. But I am comfortable with this causality being if not as “certainty”, but an at least a “certain likelihood”.
In my book, I have demonstrated how, in 2014, the stronger dollar was a concurrent necessity with respect to rising rates and thus a dominant trade. That meant by the time the Fed tightened, dollar would have to have strengthened but it might have (and did!) strengthened even without the tightening.
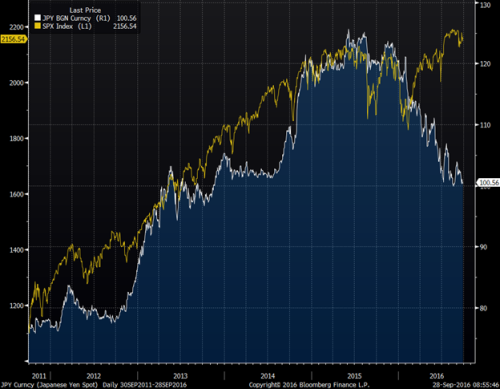
There are, however, highly correlated pairs of market events with a more obscure causality relationship. For example, up until 2016, USDJPY traded in high correlation with all risk assets, including not only the Nikkei but also the S&P 500. In my post, The Tale of Three Shorts, I have discussed some of the complexity there and even suggested that strong JPY trade may be a self-defeating chicken (a thesis yet to be verified). To put in simply, the correlation was obvious to me, but the causality wasn’t.
In such situations, I refer to events as “indicators” rather than “causes”. I have several times heard sentences like “weaker USDJPY spells trouble for stocks”. Such statements irked me as logically flawed, but the fallacy is not immediately obvious. Indeed, stocks tend to go down when JPY strengthens, don’t they?
This is where I introduce the notion of the concurrent indicator. If I look at my screen and see USDJPY up on the day and don’t look at anything else - what is my guess about the stock market? Of course, it’s more likely that the stocks are up. But why shouldn’t I look at anything else? I have a full screen of prices available.
My point is that USDJPY doesn’t convey any information about equities that I can’t see by looking at the equity screens. Yes, usually when USDJPY falls, S&P 500 trades lower as well, but if it did not go down there is no obvious ECONOMIC causality saying that it has to catch up. So, as I see it there is little predictive power to gain from divergence in this pair; what has happened, already happened. And with this mindset I was not at all shocked with the divergence of this year.
5Yr Chart of USDJPY (White) vs SPX (Yellow)
But what about the clearly statistically confirmed “leading” indicators? My contention here is that even those may not convey as much useful information as appears.
As you can guess, I am taking a swipe at the maxim that flat yield curves forecast recessions and steep yield curves forecast robust economic growth, which appears to be accepted by market participants almost without question.
The evidence is undoubtedly strong - flat curves indeed preceded all the recent recessions. But my question is, “does the curve convey any information about the possibility of a recession, we don’t have otherwise?”
Imagine that you have jumped from the roof of a high-rise. Falling past the 10th floor is a very reliable indicator of soon hitting the ground, but what new information does it contain? Given that you jumped off consciously and are familiar with the law of gravity - none.
What if you fell while sleeping? Well, waking up to see the 10th-floor flash by is definitely good info. But returning the analogy to macro-trading, my assumption is that you are not asleep.
Then what if the law of gravity changes? In this case, the 10th floor may not even be a reliable leading indicator anymore.
Over the last few decades, we got used to certain patterns of the business/rates cycle. Events were happening in a certain order and over certain predictable time intervals:
1. Rapid economic growth
2. Tight labor market and inflationary pressure
3. Rising rates
4. Yield curve flattening
5. Hiking cycle
6. Bear stock market
7. Rates fall
8. Growth slows down
9. Easing cycle
10. Curve steepens
11. Stock market rebounds
12. Rapid economic growth
Notice, any of the events in this loop could be used as reliable leading indicators for any subsequent events. Assuming the loop persists.
As I have discussed in Chapter 4 of my book, historical patterns are important to study because they are more likely to repeat than not. But if we make an a priori assumption that this loop will just keep going on without alteration - we almost wouldn’t need to observe anything else - we would already know what happens next.
In that chapter, I gave an example of using interest rate momentum as a predictor of future stock market price action. That is, I showed a decent fit between the two-year backward looking change in the 10-year note yield and the two-year forward-looking change in S&P 500. In the loop above it would mean bullet point 7 (rates fall) is a leading indicator of 11 (stock market rebounds).
Backward-Looking Change in 10yr Yields vs Forward-Looking Change in S&P500
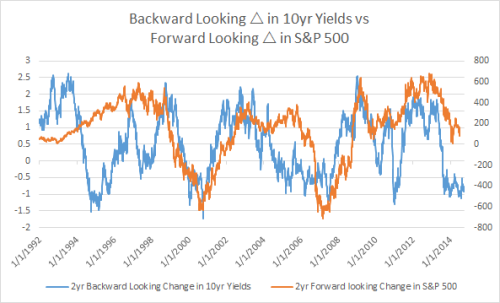
Why is there good information in this pattern? My claim is that the information is there because there is CAUSALITY. Lower funding rates lead to improved corporate profits. And this simple paradigm lends extra strength to my pattern argument.
When, however, people make the assumption that 4 (yield curve flattening) predicts 8 (economic slowdown), their assumptions are not backed up by direct causality. This does not imply the indicator is wrong, but rather it makes it more fragile.
In the past decades, 4 (yield curve flattening) was typically associated with 5 (hiking cycle). However, as we have approached zero rates and entered the world of QE, the laws of gravity have changed. Curves in the developed world are flattening in the LOW rate environment and they are no longer backed by the causality of the increased funding cost.
The jury is out on whether in the new environment yield curves will reliably forecast the business cycle. My contention is that they are unlikely to carry any information not already familiar to an alert macro player. For myself, I will stick to indicators resting on the simple and evident logic of causality.
Journey of Cash
A fascinating debate about equity valuations and the validity of lofty bond prices rages on. Some macro thinkers such as @MarkYusko, while not exactly calling top of the stock market, recommend building a substantial cash position. Their strategy is to wait in order to take advantage of an eventual, inevitable bursting of the equity bubble.
I do not intend to contribute an opinion to whether equities are currently a bubble or not; in fact, I have no opinion to contribute. But assuming some reasonable concern over valuations, cash appears aligned with my own recommendations in Chapter 5 of my book. In that chapter I propose sitting out the bubbles rather than trying to aggressively time them. This strategy avoids the risk of blowing up either on the short or on the long side.
However, it is important to understand that line of reasoning is predicated on the assumption that “cash” is actually SAFE.
For an individual cash has two separate, though interwoven aspects: cash is a means to pay for one’s lifestyle and it is a financial asset.
Those financially less secure will require the safety of cash to meet their immediate needs such as rent or food. If they are fortunate to have some savings they may be concerned that cash may fail to keep up with inflationary pressure, but if they live paycheck to paycheck they must count on the wage inflation.
For the purposes of this post, however, I am using the term ‘cash’ from the perspective of a money manager whose central objective is absolute performance. For such a manager, cash is purely a financial asset.
Managers tend to think of cash as “safe”. They lean on the thinking that when benchmarked to cash, cash will never deliver a negative return which is important both psychologically and in terms of calculating incentive fees. But such benchmarking is somewhat arbitrary: for example if you are benchmarked to gold your safest asset is gold and when you are benchmarked to S&P 500 your safest asset is…And so on.
The very concept of a “risky” asset comes from benchmarking.
While the concept of over/underperformance vs. a benchmark is relative to the choice of benchmark, the absolute performance is unambiguous. And by absolute I mean absolute - weighted by the performance of your base currency. That is a Euro-based asset manager who delivered a 10% return in 2014 still underperformed USD cash on that year. Notice that as incentive fees are calculated in base currency, most money manager wouldn’t currency-weigh their performance.
But if you are a truly global money manager you can think of cash as unsafe in three different ways:
- You have base currency risk
- You have benchmark risk, i.e. if you are supposed to track a stock index and you stay in cash - well you know what bad things may happen…
- You may underperform competitors in terms of returns in base currency
In summary, as a global manager, I view cash as an asset as risky as all others. My goal is absolute performance. While long-only managers can only make a decision to hold or not to hold cash, I have the option to be short or long cash like any other asset.
Indeed, using leverage to go long another financial asset is equivalent to going short cash, while going short an asset is equivalent to going leveraged long cash.
Having established our view of cash as a highly speculative investment, let’s look at how it is has performed.
USD cash was a good place to be invested early in 2008. The dollar index bottomed out in March 2008 and surged over the next year to make a cyclical top in March 2009 - the same month the stock market made its bottom. Over that year, dollar cash beat all stock markets, most commodities, most other currencies, most risky bonds. It only underperformed Treasuries - as one might have expected.
A bubble had formed. Yes the greatest bubble of this millennium (so far) was not Internet-2000, Sunprime-2006 or Bitcoin-2014.
It was Cash-2009.
Panicked, trading chickens who had piled into this cash bubble were brutally punished as recovering asset prices left them behind. How do I know that? Well, somebody had to be my counterparty.
Much of my success in subsequent years was due to recognizing this bubble and following my advice to sit it out. No, I didn’t go short cash. I just rotated my money out of it into the “safe haven” of stocks.
After an initial rebound, I got an additional tailwind as the Fed started to pound on cash by the wave of supply provided by multiple QEs.
Between 2010 and 2014 I gradually realized that the other CB’s will have to follow suit and destroy the value of their own cash. Now it was time to short foreign cash. The One Trade was born.
My version of it was not to be just long Treasuries, but to build leverage funding them in low (and now negative) yielding DM currencies.
The continuing success of that trade has been nothing short of magical.
But, now the question is whether the trade has gone too far and the cash has actually become too cheap? The question more ambiguous as to whether I mean dollar or RoW cash. Much of the recent underperformance of USD-based mangers can be explained by the fact that they are benchmarked to strongly performing asset: USD.
Thus far my answer was to be slightly less net short cash, i.e. book some profits but still run the core position. Why am I being so stubborn, despite the lofty asset valuations?
When I think of cash as an asset (or even as a commodity?) there is practically no limit to how cheap you can get it by producing more and more of it. And that is what the BoJs and the ECBs of the world have been doing without any sign of stopping so far.
So is their no risk to being long bonds vs. cash? Theoretically there is. Going back to the duality of cash we have discussed earlier, cash can cheapen in two different ways:
- Against real goods and services
- Against financial assets
So far we are only seeing the latter in DM. The former is called inflation and when it arrives some financial assets may do even worse than cash. Paradoxically, in the event of an inflation scare, cash is historically the place to be as the DM CBs tend to protect it by raising rates and keeping its total return positive. Negative real interest rates are typically a product of a deflationary environment.
My central thesis is that secular automatization and globalization still channel excess cash into the asset rather than goods prices. But cyclical inflationary forces are not to be disregarded out of hand.
The case for cash is not proven, but it needs to be heard.
eldorado73 asked: