How To Predict The Stock Market
Finding My Role
One of the things I like so much about Steemit is that as a new community it seems to have so many roles yet to be filled. Where are our artists? Our musicians? Our daredevils? And what role can I fill? Since I spend much of my time studying markets, perhaps this could be my role. As a student of economics, political economy, and finance I do believe I have a unique and insightful perspective that would certainly be more helpful than what you are likely to hear from the mainstream media. In addition, I will provide real predictions which will be proven right or wrong which will enable the reader to monitor my success rate (and failure rate). With that being said, I present you with a quick market analysis of the Dow Jones Index going into Thursday, June 30th, the last trading day of the month of June.
THIS IS NOT INVESTMENT ADVICE
I am not a licensed investment professional. What follows are my personal opinions and thoughts which I will use to determine my own trades. You should always consult a licensed investment professional before putting your money at risk and you should never believe anything anyone says on the internet.
Summary
For those who don't care as much about the analysis, and just want the bullets, here's my broad take on the "State of the Dow." To better understand why I take the following positions, read on past this section.
- Despite the turmoil generated by Brexit, the price of the Dow failed to rise or fall to sufficiently high or low levels to signal a major move in either direction. In short, there is no indication that the Dow will Crash or skyrocket yet.
a. Those critical numbers are 17,120 and 17,900. If the Dow moves past 17,120 (and especially if it closes below that level) this will signal that more downward movement is likely. If it moves past 17,900 (and again, especially if it closes above that level) this will signal that more upward movement is likely in the next few trading days.
b. These numbers are derived from technical analysis which is boring. See for yourself if they're good and if they're not, ignore them. - Today, however, is crucial because it is the last trading day of the month. Where markets close at the end of the month (the prices set at the last moment of trading in the day) are especially strong indicators of future movement.
a. The BIG number is 18,137.50. A closing today above this number will indicate that the Dow is very strong and could go as high as 20,000 in September. If the price fails to rise above that level and close there, this would make reaching 20,000 in September unlikely, though as long as there is still a closing above 17,900 the Dow should still continue to move upward albeit at a less aggressive pace. - The Dow, and US stocks generally are not as weak as many may think. While it might be tempting to think that issues like Brexit and the overall disintegration of the European Union are necessarily bad for US stocks, it's important to remember that capital has to go somewhere. These national crises (including but not limited to sovereign debt crises) are scaring capital out of typical safe havens like government bonds, away from currencies other than the dollar, and into American stocks. The Dow is where international capital seeks refuge when government bonds and currencies are seen as unsafe. It is therefore entirely possible that the Dow could drive upward, but the market has failed to provide the requisite strong indicators for this action. As of yet.
Last Trading Day of the Month
Traders give special attention to the last trading day of the month. For whatever reason, what the markets do on the last day of the month tends to be a stronger indicator of future movements than what transpires on other trading days. The strongest indicators in order of importance are: yearly closings, quarterly closings, monthly closings, weekly closings, and daily closings. Price movements which occur during the trading day are not believed to be as important an indicator as what the prices close at. This could be because all the information provided throughout the day, including the information expressed in the price changes that transpire, are factored into the closing price. This same logic could be applied to weekly, quarterly, and yearly closings as well. The weekly closing is based on all the information gleaned throughout the week. The quarterly closing is based on all the information gleaned throughout the quarter and so on.
Bremain
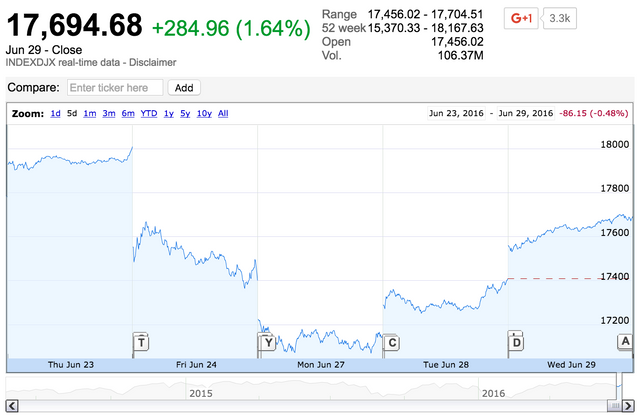
These last two weeks have certainly been exciting. From Monday the 20th to the 22nd the Dow traded from around 17,900 to 17,800. Then on the 23rd (the day of the Brexit vote) the market opened up 114 points from the previous day's closing at 17,914 and kept rising to close at 18,008. Throughout the day until the close of trading consensus seemed to be that the vote would be in favor of "Remain." While in most cases I would advise people to take claims of a causal relationship between a news item and market behavior with a heaping spoonful of salt, given the highly unusual nature of the relevant news event (Brexit) and its unusually high stakes, it seems reasonable to assume that the perceived likelihood of a "Remain" vote gave traders confidence in markets which helped push prices up. Since polls are more accurate the closer they are to the event, it makes sense that traders would let the real-time polls affect their judgment.
Brexit
They were, of course, mistaken. That night it became clear that the British people had, in fact, voted to Brexit. If we continue with the theory that the previous day's positive movement was due to the perceived likelihood of a Remain vote, then it should not come as a surprise that on Friday, June 24th the Dow opened down 399 points at 17,609. It continued to drop another 200 points throughout the day, then opened down another 200 points the next trading day, Monday the 27th, hovering everywhere within the 17,100s and closing at 17,140. But what does all of this mean? What's going to happen next?
Technical Analysis
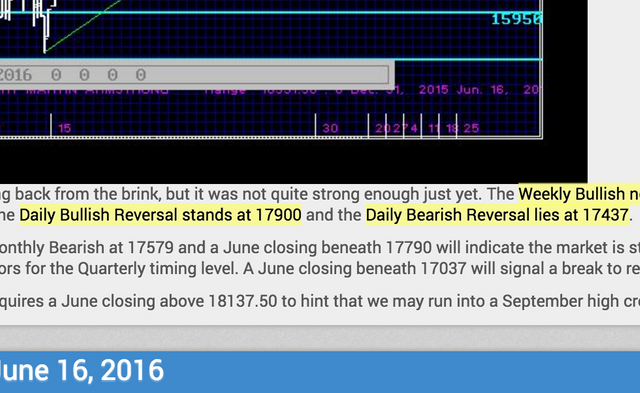
I use the technical analysis provided by Martin Armstrong. If you find this analysis useful you should check out his site, and consider subscribing to his market analysis software Socrates. According to Armstrong the numbers you should be paying specific attention to are $17,120 and $17,800. According to Armstrong, if the price of the Dow drops below $17,120 this would signal that it could drop further still. On the other hand, if the price were to exceed $17,800 this would signal the possibility of further increase. These numbers are determined by drawing trend lines through the previous lows and highs of the given market plus additional proprietary trend analysis techniques based on wave theory.
Update: This 17,800 number was an error, but instead of rewriting history I'm leaving it here. Armstrong's upper bound was always 17,900. This was my error, not his. Below is a screen grab of his private blog. In my updates I unknowingly corrected the error, so the number should be right in those. My apologies for any confusion. To avoid further confusion I will change the numbers in the rest of the article out of fear that it might otherwise impact people's trading decisions even though THIS IS NOT INVESTMENT ADVICE. I should point out that I have no reason to prefer the 17,900 number over 17,800. It would just change my analysis.
Traders Hate Uncertainty
It should come as no surprise that the Brexit vote made everyone skittish. Assuming that the markets would take the news negatively is usually a pretty safe bet in this type of scenario (where outcomes are very uncertain), the only question is whether your can actually get your trade in before the market has already priced in the uncertainty. Personally, I do not try to play these games of trying to figure out how people's irrational behaviors will affect markets. It's too risky, time consuming, and nerve-wracking.
The Roller Coaster
Despite the big downturn caused ostensibly by the Brexit vote, the Dow only broke through Armstrong's number intraday (within trading hours, but not the close) hitting a low of $17,076 but closing at 17,140. Armstrong calls this "testing resistance" (it's trader lingo). The market went below the "resistance" at 17,120 during the day but the fact that it closed above it signaled potential strength in the market. Had it closed below 17,120 this would have been a signal that the market would likely move lower. The next day the market opened up big (200+ points) and closed up around 17,400. Yesterday it opened up again this time 136 points (17,543), and closed up further at 17,691.
So what does it all mean?
The fact that the Dow tested the 17,120 bearish resistance level means that big downward movement is not off the table. However, it would seem that it tested this number in a moment of exceptional uncertainty. The fear with Brexit was that there was a chance that it could trigger some global financial catastrophe. The fact that the price only briefly traded below the resistance, eventually closed above it, and then reversed course to the upside rather aggressively for two days straight would indicate to me that the Dow may have recovered from Brexit fears.
The 2-3 Time Units Rule
At the same time, however, Armstrong frequently points out that reactions tend to last 2-3 time units (which can be days, weeks, quarters, or years). In this case what we may have been seeing was a reversal in trend due to the failure of the price to decisively break through the 17,120 level. Were the price to change trend tomorrow and head back down this would signal that the rising price over the last couple of days was a reaction high (a temporary upward surge) and not a long term trend. If prices continue to go up on the 30th (today) but fail to close above 17,900, then the 2-3 time units (in this case "days") would have passed since the low and so a change in trend would be more likely, in which case Monday would likely see a decline. Closing above 17,900 would signal strength in the Dow and a potentially extended rally.
Breakout in the Dow?
In order to see a "breakout" of the Dow (a rapid and prolonged rise) it must close above 18,137.50 tomorrow. Failure to do so would make such a move unlikely for now. A closing tomorrow above this would signal strength in the Dow which could drive its price up to the 20,000 range in September. Given the level of volatility in the markets I wouldn't be surprised if there were big moves in the Dow tomorrow, however, a gain big enough to reach 18,137.50 seems unlikely. Breaking 17,900 would still be good, but a failure to do so would signal weakness and therefore a potential move down.
A Crash in the Dow?
All of that being said, I see no reason to fear a Dow crash. Prices might drop down again but if they fail to really burst through that 17,120 number I would consider buying as it would likely rise yet again, possibly to once again try to reach that 18,137 number. Of course, if the Dow does move decisively below 17,120 (for example closing below it) beware it would likely continue to move lower. Were I the owner of a Dow Jones Index Fund in this scenario I would consider selling and waiting until the market sent more signals of strength before once again going long the Dow.
Update
I have added a real-time update to this post which can be read here.
Thanks!
Thanks for reading my Dow Jones Stock Market Analysis! If you have any questions, or your own analysis (e.g. your own technical/fundamental analysis) feel free to include it in the comment section and if I find it of sufficiently high quality I'll incorporate it into the post.
THIS IS NOT INVESTMENT ADVICE
I am not a licensed investment professional. What follows are my personal opinions and thoughts which I will use to determine my own trades. You should always consult a licensed investment professional before putting your money at risk and you should never believe anything anyone says on the internet.
It signaled the Plunge Protection Team was on the job. ;)
I can't speak to how the PPT performs its functions, or whether it really exists at all. Instead I prefer to focus on making predictions based on the available evidence and seeing how they perform. Their behaviors are, after all, baked into the price. The most the PPT can do is short-term manipulation. If they can leverage their capital to force markets above or below certain technical indicators that's certainly interesting, but not necessarily of special importance. In fact, if they exist and are (for example) incapable of keeping a market above bearish resistance then this should be even stronger evidence of future negative movement. If they are unable to push a market above bullish resistance, this is an even stronger indicator that the market isn't as strong as it might seem. Please feel free to return to this post and see how it holds up. I'm very curious myself!
Executive Order 12631. But they would never abuse their powers, no way ... and the whistleblowers are just lying conspiracy theorist. :)
hahaha. I actually think they just don't have as much power as they wish they did, but yes certainly they abuse whatever power they have.